

Answered step by step
Verified Expert Solution
Question
1 Approved Answer
please show steps The figure below shows graphs of the total cost and revenue functions, and the fixed cost for a certain commodity. Capacity is
please show steps 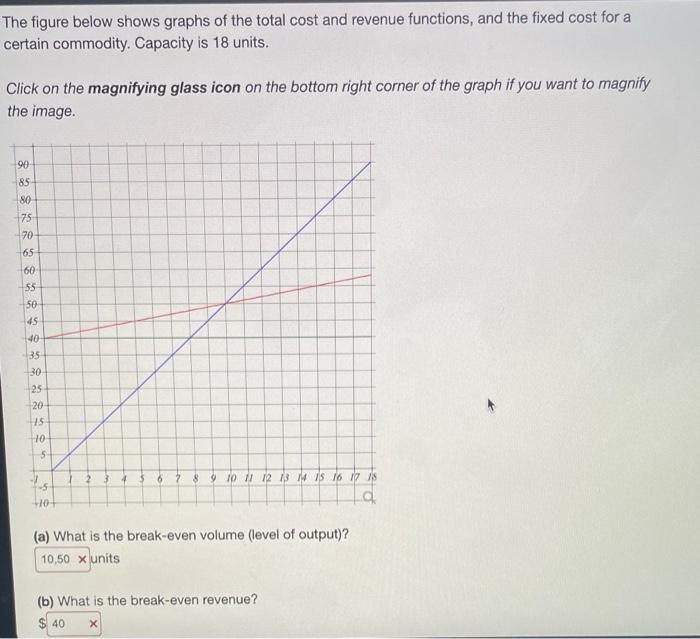
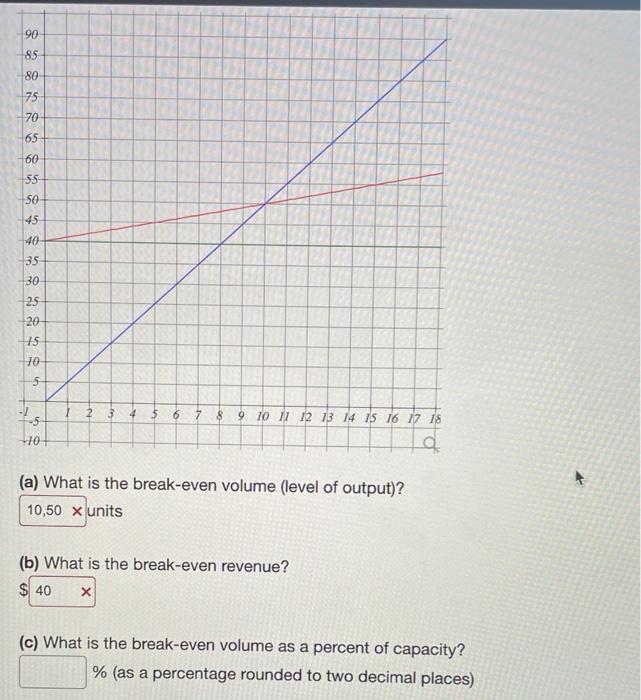
The figure below shows graphs of the total cost and revenue functions, and the fixed cost for a certain commodity. Capacity is 18 units. Click on the magnifying glass icon on the bottom right corner of the graph if you want to magnify the image. (a) What is the break-even volume (level of output)? units (b) What is the break-even revenue? (a) What is the break-even volume (level of output)? units (b) What is the break-even revenue? $ (c) What is the break-even volume as a percent of capacity? \% (as a percentage rounded to two decimal places) Step by Step Solution
There are 3 Steps involved in it
Step: 1

Get Instant Access to Expert-Tailored Solutions
See step-by-step solutions with expert insights and AI powered tools for academic success
Step: 2

Step: 3
Ace Your Homework with AI
Get the answers you need in no time with our AI-driven, step-by-step assistance
Get Started
An Audit Of Police Oversight In Africa
Authors: African Police Oversight Forum
1st Edition
1920299173, 978-1920299170