Please show the answer to every step in excel format. THIS ISN'T A CODING PROBLEM. Thanks!
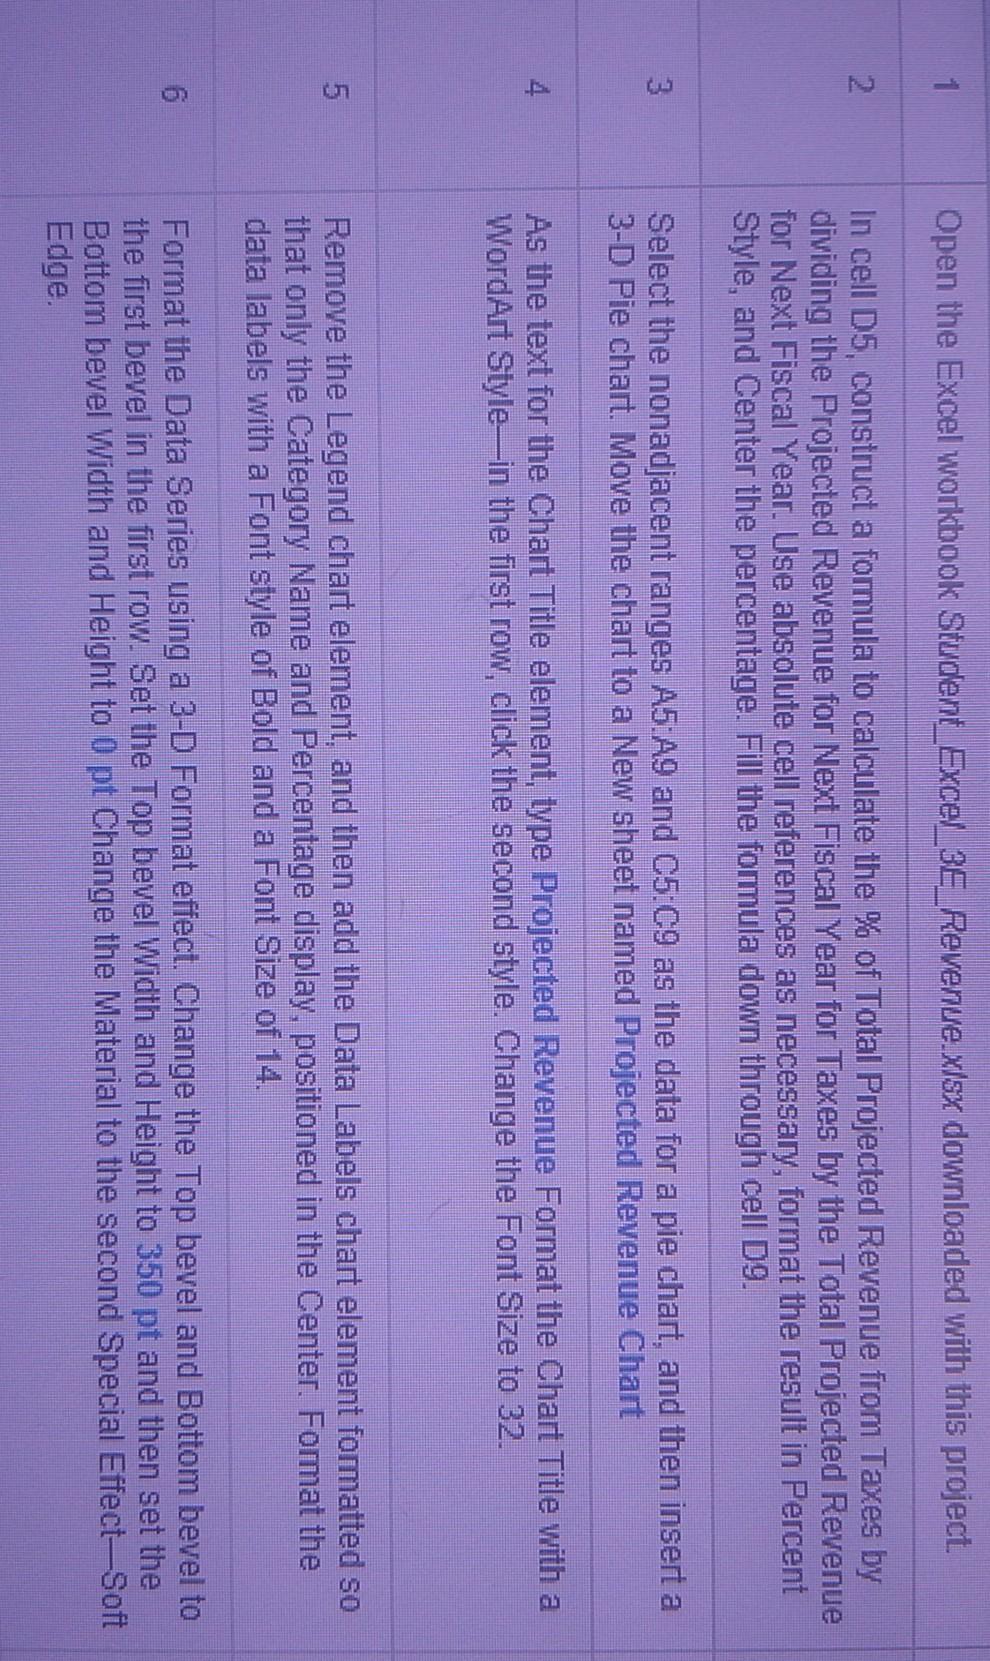
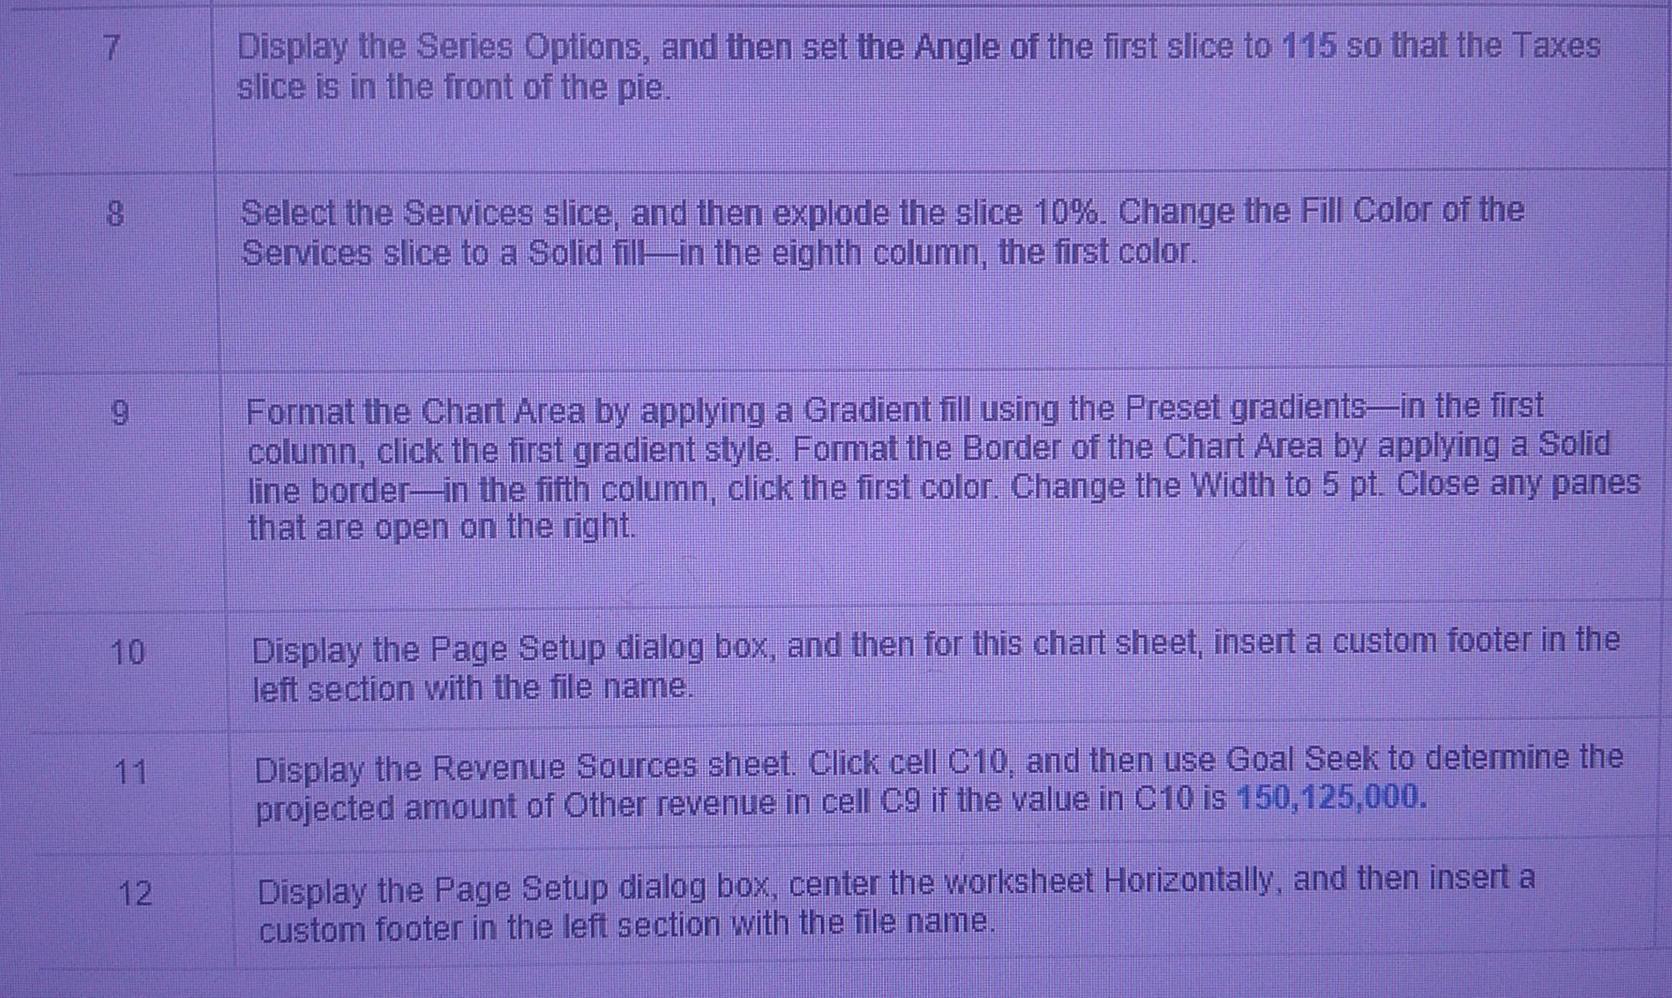
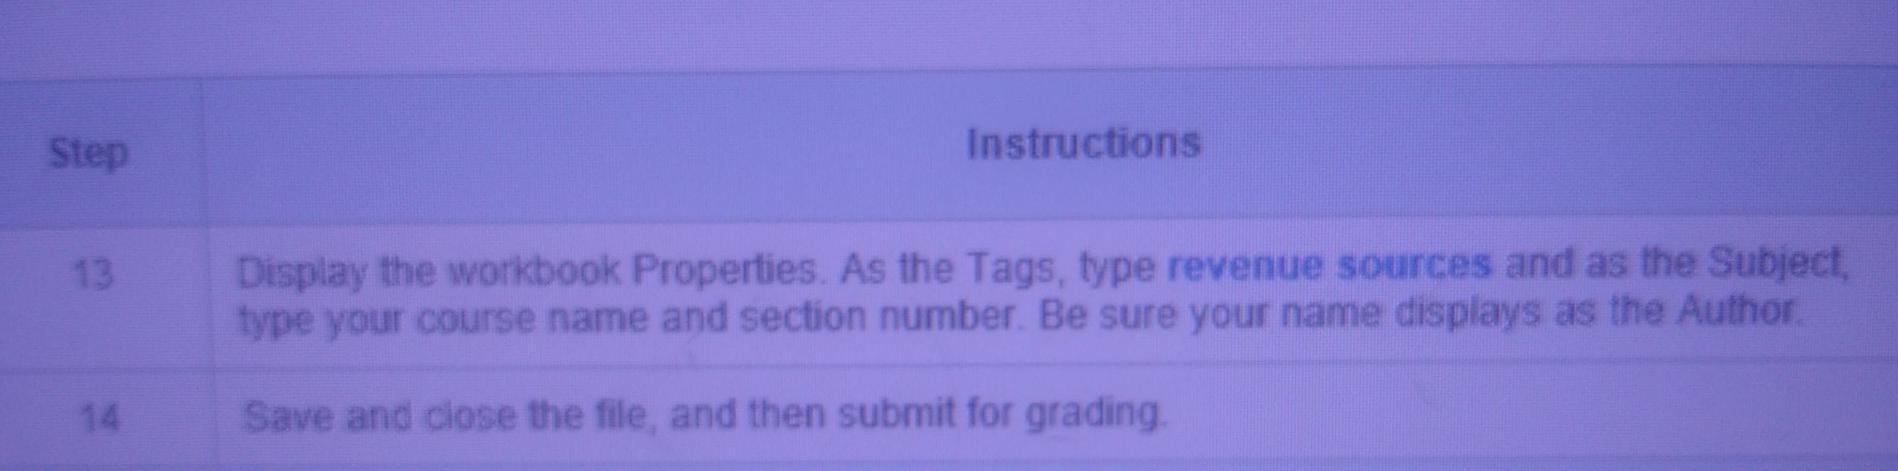
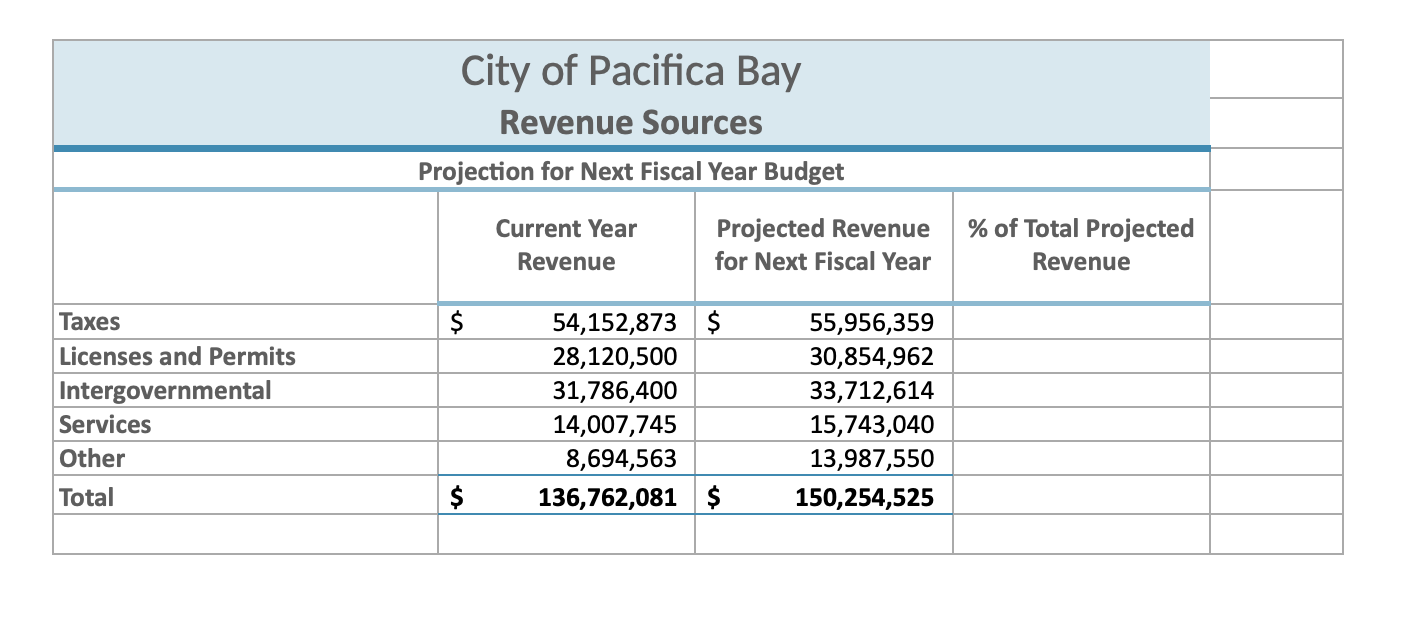
1 Open the Excel workbook Student_Excel_3E_Revenue.x/sx downloaded with this project. In cell D5, construct a fomula to calculate the % of Total Projected Revenue from Taxes by dividing the Projected Revenue for Next Fiscal Year for Taxes by the Total Projected Revenue for Next Fiscal Year. Use absolute cell references as necessary, format the result in Percent Style, and Center the percentage. Fill the formula down through cell D9. Select the nonadjacent ranges A5:A9 and C5:09 as the data for a pie chart, and then insert a 3-D Pie chart. Move the chart to a New sheet named Projected Revenue Chart 4 As the text for the Chart Title element, type Projected Revenue Format the Chart Title with a WordArt Stylein the first row, click the second style. Change the Font Size to 32. Remove the Legend chart element, and then add the Data Labels chart element formatted so that only the Category Name and Percentage display, positioned in the Center. Format the data labels with a Font style of Bold and a Font Size of 14. 6 Format the Data Series using a 3-D Format effect. Change the Top bevel and Bottom bevel to the first bevel in the first row. Set the Top bevel Width and Height to 350 pt and then set the Bottom bevel Width and Height to 0 pt Change the Material to the second Special Effect-Soft Edge. Display the Series Options, and then set the Angle of the first slice to 115 so that the Taxes slice is in the front of the pie. 8 Select the Services slice, and then explode the slice 10%. Change the Fill Color of the Services slice to a Solid fill in the eighth column, the first color. Format the Chart Area by applying a Gradient fill using the Preset gradientsin the first column, click the first gradient style. Format the Border of the Chart Area by applying a Solid line border-in the fifth column, click the first color. Change the Width to 5 pt. Close any panes that are open on the right. 10 Display the Page Setup dialog box, and then for this chart sheet, insert a custom footer in the left section with the file name. Display the Revenue Sources sheet. Click cell C10, and then use Goal Seek to determine the projected amount of Other revenue in cell C9 if the value in C10 is 150,125,000. Display the Page Setup dialog box, center the worksheet Horizontally, and then insert a custom footer in the left section with the file name. Step Instructions Display the workbook Properties. As the Tags, type revenue sources and as the Subject, type your course name and section number. Be sure your name displays as the Author Save and close the file, and then submit for grading. City of Pacifica Bay Revenue Sources Projection for Next Fiscal Year Budget Current Year Revenue Projected Revenue for Next Fiscal Year % of Total Projected Revenue $ Taxes Licenses and Permits Intergovernmental Services Other 54,152,873 $ 28,120,500 31,786,400 14,007,745 8,694,563 136,762,081 $ 55,956,359 30,854,962 33,712,614 15,743,040 13,987,550 150,254,525 Total $ 1 Open the Excel workbook Student_Excel_3E_Revenue.x/sx downloaded with this project. In cell D5, construct a fomula to calculate the % of Total Projected Revenue from Taxes by dividing the Projected Revenue for Next Fiscal Year for Taxes by the Total Projected Revenue for Next Fiscal Year. Use absolute cell references as necessary, format the result in Percent Style, and Center the percentage. Fill the formula down through cell D9. Select the nonadjacent ranges A5:A9 and C5:09 as the data for a pie chart, and then insert a 3-D Pie chart. Move the chart to a New sheet named Projected Revenue Chart 4 As the text for the Chart Title element, type Projected Revenue Format the Chart Title with a WordArt Stylein the first row, click the second style. Change the Font Size to 32. Remove the Legend chart element, and then add the Data Labels chart element formatted so that only the Category Name and Percentage display, positioned in the Center. Format the data labels with a Font style of Bold and a Font Size of 14. 6 Format the Data Series using a 3-D Format effect. Change the Top bevel and Bottom bevel to the first bevel in the first row. Set the Top bevel Width and Height to 350 pt and then set the Bottom bevel Width and Height to 0 pt Change the Material to the second Special Effect-Soft Edge. Display the Series Options, and then set the Angle of the first slice to 115 so that the Taxes slice is in the front of the pie. 8 Select the Services slice, and then explode the slice 10%. Change the Fill Color of the Services slice to a Solid fill in the eighth column, the first color. Format the Chart Area by applying a Gradient fill using the Preset gradientsin the first column, click the first gradient style. Format the Border of the Chart Area by applying a Solid line border-in the fifth column, click the first color. Change the Width to 5 pt. Close any panes that are open on the right. 10 Display the Page Setup dialog box, and then for this chart sheet, insert a custom footer in the left section with the file name. Display the Revenue Sources sheet. Click cell C10, and then use Goal Seek to determine the projected amount of Other revenue in cell C9 if the value in C10 is 150,125,000. Display the Page Setup dialog box, center the worksheet Horizontally, and then insert a custom footer in the left section with the file name. Step Instructions Display the workbook Properties. As the Tags, type revenue sources and as the Subject, type your course name and section number. Be sure your name displays as the Author Save and close the file, and then submit for grading. City of Pacifica Bay Revenue Sources Projection for Next Fiscal Year Budget Current Year Revenue Projected Revenue for Next Fiscal Year % of Total Projected Revenue $ Taxes Licenses and Permits Intergovernmental Services Other 54,152,873 $ 28,120,500 31,786,400 14,007,745 8,694,563 136,762,081 $ 55,956,359 30,854,962 33,712,614 15,743,040 13,987,550 150,254,525 Total $