

Answered step by step
Verified Expert Solution
Question
1 Approved Answer
Please show the excel formulas. Problem 1 Use the Bonus assignment excel file on Blackboard. The file contains annual prices and dividends for Apple (AAPL)
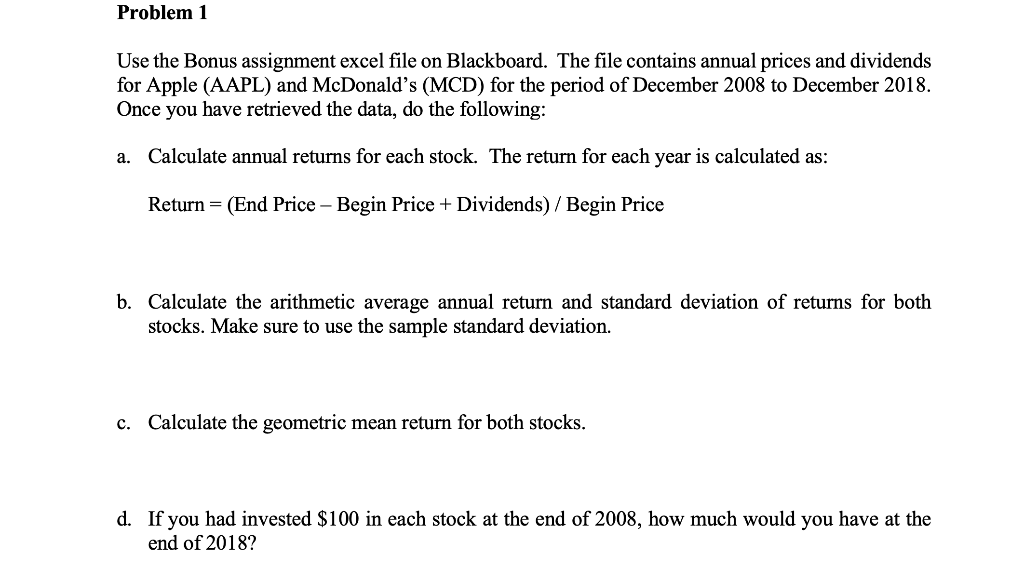
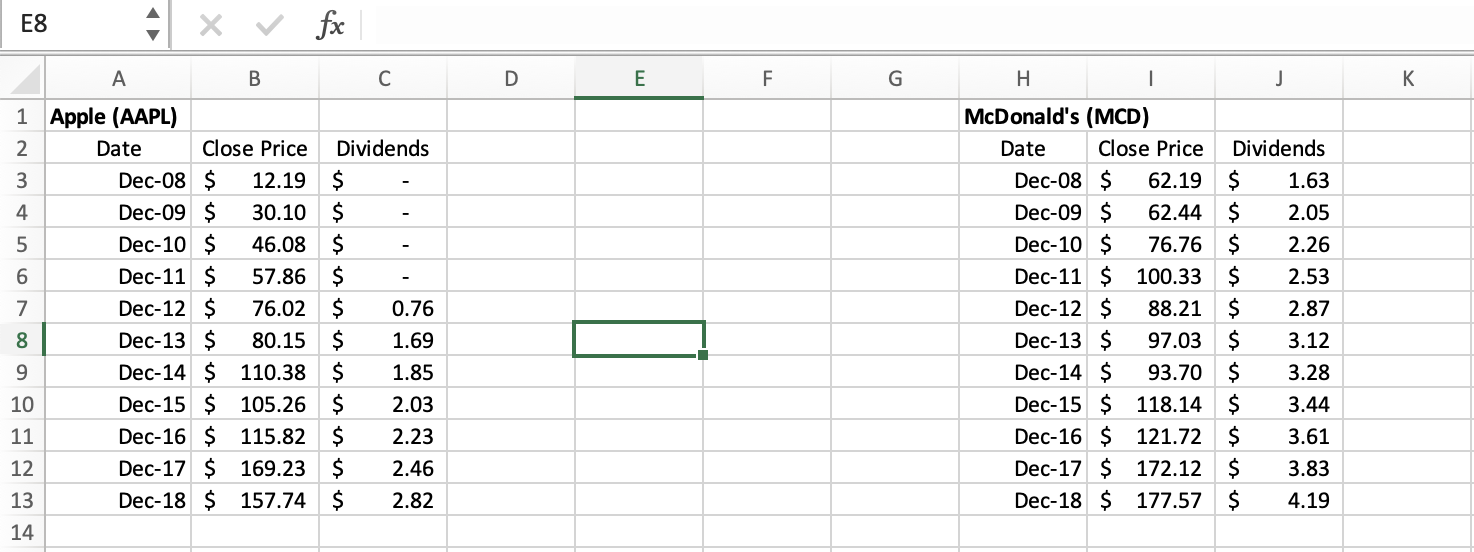 Please show the excel formulas.
Step by Step Solution
There are 3 Steps involved in it
Step: 1

Get Instant Access to Expert-Tailored Solutions
See step-by-step solutions with expert insights and AI powered tools for academic success
Step: 2

Step: 3
Ace Your Homework with AI
Get the answers you need in no time with our AI-driven, step-by-step assistance
Get Started
Financing Nonprofits Putting Theory Into Practice
Authors: Young, Dennis R.
1st Edition
0759109885,0759114129