

Answered step by step
Verified Expert Solution
Question
1 Approved Answer
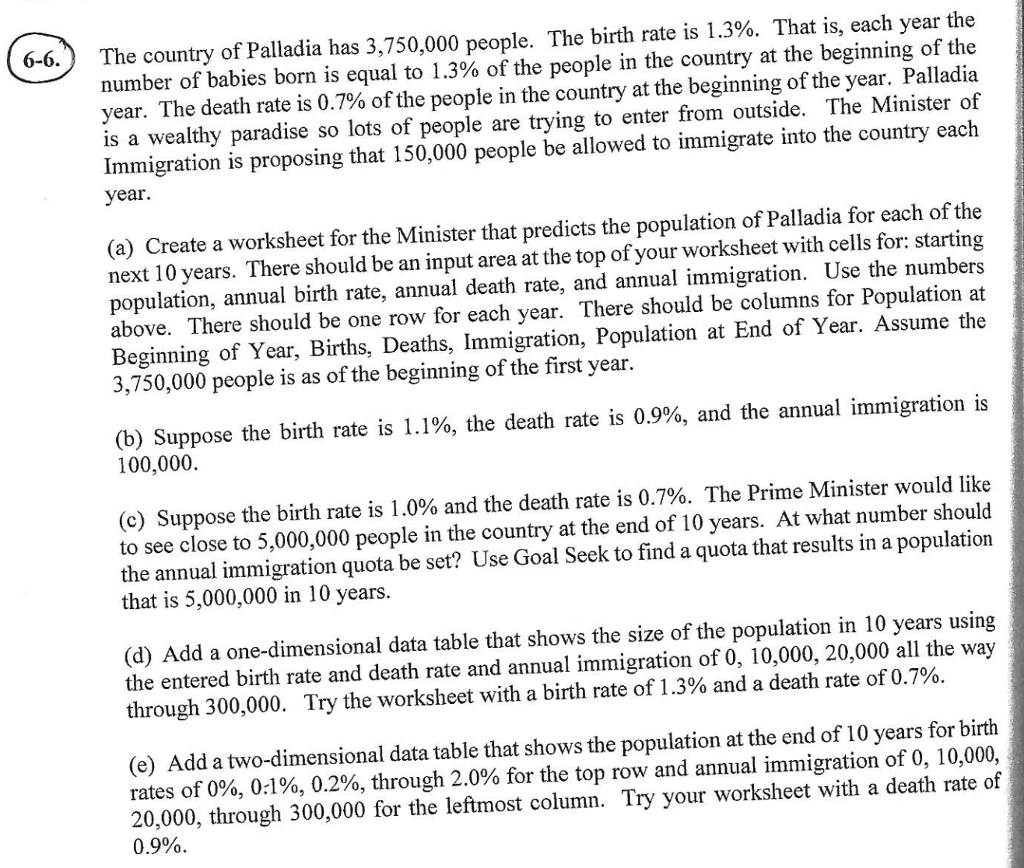
Please show the step by step instructions using an excel file. The country of Palladia has 3,750,000 people. The birth rate is 1.3%. That is,
 Please show the step by step instructions using an excel file.
Step by Step Solution
There are 3 Steps involved in it
Step: 1

Get Instant Access to Expert-Tailored Solutions
See step-by-step solutions with expert insights and AI powered tools for academic success
Step: 2

Step: 3
Ace Your Homework with AI
Get the answers you need in no time with our AI-driven, step-by-step assistance
Get Started
Database Marketing The Ultimate Marketing Tool
Authors: Edward L. Nash
1st Edition
0070460639, 978-0070460638