

Answered step by step
Verified Expert Solution
Question
1 Approved Answer
Please show the table and each step on how to sketch the graph. please explain every step so it can help me understand. 250 will
Please show the table and each step on how to sketch the graph. please explain every step so it can help me understand. 
250 will represent the A value. Please explain every step. Also, please make a table of values to show steps on how to sketch the graph 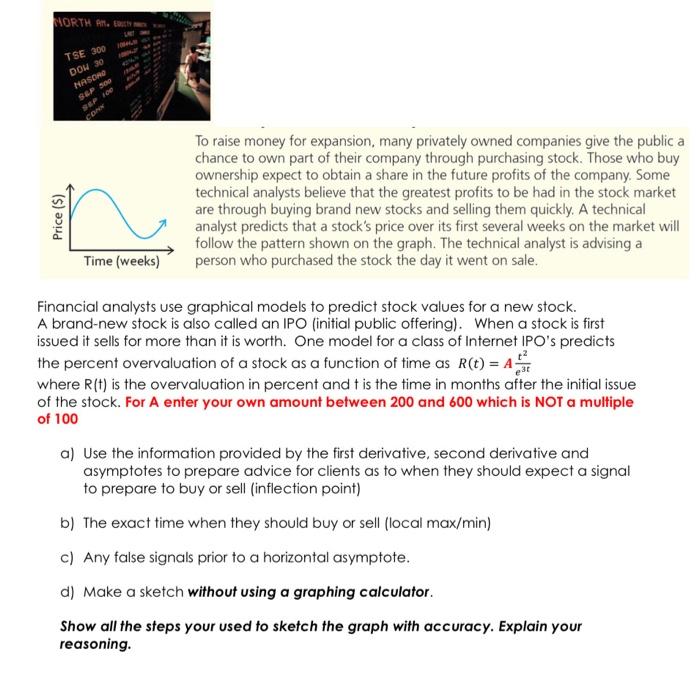
NORTH Ant TSE 300 DOH 30 NASORO SEP 300 CON Price ($) To raise money for expansion, many privately owned companies give the public a chance to own part of their company through purchasing stock. Those who buy ownership expect to obtain a share in the future profits of the company. Some technical analysts believe that the greatest profits to be had in the stock market are through buying brand new stocks and selling them quickly. A technical analyst predicts that a stock's price over its first several weeks on the market will follow the pattern shown on the graph. The technical analyst is advising a person who purchased the stock the day it went on sale. Time (weeks) Financial analysts use graphical models to predict stock values for a new stock. A brand-new stock is also called an IPO (initial public offering). When a stock is first issued it sells for more than it is worth. One model for a class of Internet IPO's predicts the percent overvaluation of a stock as a function of time as r(t) = A where R(t) is the overvaluation in percent and is the time in months after the initial issue of the stock. For A enter your own amount between 200 and 600 which is NOT a multiple of 100 a) Use the information provided by the first derivative, second derivative and asymptotes to prepare advice for clients as to when they should expect a signal to prepare to buy or sell (inflection point) b) The exact time when they should buy or sell (local max/min) c) Any false signals prior to a horizontal asymptote. d) Make a sketch without using a graphing calculator. Show all the steps your used to sketch the graph with accuracy. Explain your reasoning. NORTH Ant TSE 300 DOH 30 NASORO SEP 300 CON Price ($) To raise money for expansion, many privately owned companies give the public a chance to own part of their company through purchasing stock. Those who buy ownership expect to obtain a share in the future profits of the company. Some technical analysts believe that the greatest profits to be had in the stock market are through buying brand new stocks and selling them quickly. A technical analyst predicts that a stock's price over its first several weeks on the market will follow the pattern shown on the graph. The technical analyst is advising a person who purchased the stock the day it went on sale. Time (weeks) Financial analysts use graphical models to predict stock values for a new stock. A brand-new stock is also called an IPO (initial public offering). When a stock is first issued it sells for more than it is worth. One model for a class of Internet IPO's predicts the percent overvaluation of a stock as a function of time as r(t) = A where R(t) is the overvaluation in percent and is the time in months after the initial issue of the stock. For A enter your own amount between 200 and 600 which is NOT a multiple of 100 a) Use the information provided by the first derivative, second derivative and asymptotes to prepare advice for clients as to when they should expect a signal to prepare to buy or sell (inflection point) b) The exact time when they should buy or sell (local max/min) c) Any false signals prior to a horizontal asymptote. d) Make a sketch without using a graphing calculator. Show all the steps your used to sketch the graph with accuracy. Explain your reasoning. NORTH Ant TSE 300 DOH 30 NASORO SEP 300 CON Price ($) To raise money for expansion, many privately owned companies give the public a chance to own part of their company through purchasing stock. Those who buy ownership expect to obtain a share in the future profits of the company. Some technical analysts believe that the greatest profits to be had in the stock market are through buying brand new stocks and selling them quickly. A technical analyst predicts that a stock's price over its first several weeks on the market will follow the pattern shown on the graph. The technical analyst is advising a person who purchased the stock the day it went on sale. Time (weeks) Financial analysts use graphical models to predict stock values for a new stock. A brand-new stock is also called an IPO (initial public offering). When a stock is first issued it sells for more than it is worth. One model for a class of Internet IPO's predicts the percent overvaluation of a stock as a function of time as r(t) = A where R(t) is the overvaluation in percent and is the time in months after the initial issue of the stock. For A enter your own amount between 200 and 600 which is NOT a multiple of 100 a) Use the information provided by the first derivative, second derivative and asymptotes to prepare advice for clients as to when they should expect a signal to prepare to buy or sell (inflection point) b) The exact time when they should buy or sell (local max/min) c) Any false signals prior to a horizontal asymptote. d) Make a sketch without using a graphing calculator. Show all the steps your used to sketch the graph with accuracy. Explain your reasoning. NORTH Ant TSE 300 DOH 30 NASORO SEP 300 CON Price ($) To raise money for expansion, many privately owned companies give the public a chance to own part of their company through purchasing stock. Those who buy ownership expect to obtain a share in the future profits of the company. Some technical analysts believe that the greatest profits to be had in the stock market are through buying brand new stocks and selling them quickly. A technical analyst predicts that a stock's price over its first several weeks on the market will follow the pattern shown on the graph. The technical analyst is advising a person who purchased the stock the day it went on sale. Time (weeks) Financial analysts use graphical models to predict stock values for a new stock. A brand-new stock is also called an IPO (initial public offering). When a stock is first issued it sells for more than it is worth. One model for a class of Internet IPO's predicts the percent overvaluation of a stock as a function of time as r(t) = A where R(t) is the overvaluation in percent and is the time in months after the initial issue of the stock. For A enter your own amount between 200 and 600 which is NOT a multiple of 100 a) Use the information provided by the first derivative, second derivative and asymptotes to prepare advice for clients as to when they should expect a signal to prepare to buy or sell (inflection point) b) The exact time when they should buy or sell (local max/min) c) Any false signals prior to a horizontal asymptote. d) Make a sketch without using a graphing calculator. Show all the steps your used to sketch the graph with accuracy. Explain your reasoning Step by Step Solution
There are 3 Steps involved in it
Step: 1

Get Instant Access to Expert-Tailored Solutions
See step-by-step solutions with expert insights and AI powered tools for academic success
Step: 2

Step: 3
Ace Your Homework with AI
Get the answers you need in no time with our AI-driven, step-by-step assistance
Get Started
Sitting Pretty On A Fixed Income Personal Finance Secrets For Seniors
Authors: FC&A Medical Publishing
1st Edition
1935574582, 9781935574583