

Answered step by step
Verified Expert Solution
Question
1 Approved Answer
Please show what you put into Excel to get the graph, struggling with setting up the problem. This question is very similar to the previous
Please show what you put into Excel to get the graph, struggling with setting up the problem.
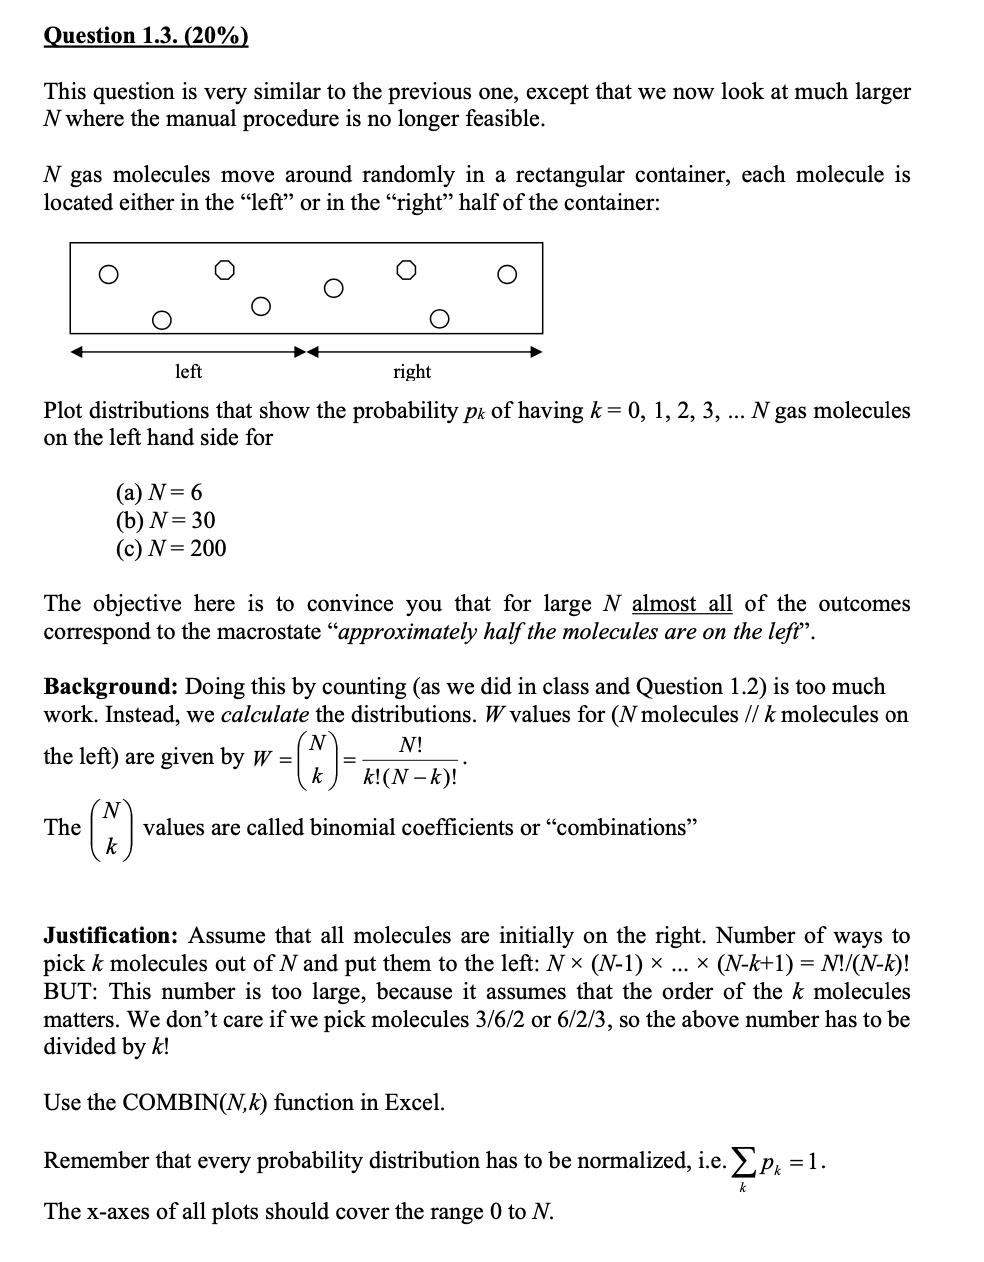
This question is very similar to the previous one, except that we now look at much larger N where the manual procedure is no longer feasible. N gas molecules move around randomly in a rectangular container, each molecule is located either in the "left" or in the "right" half of the container: Plot distributions that show the probability pk of having k=0,1,2,3,N gas molecules on the left hand side for (a) N=6 (b) N=30 (c) N=200 The objective here is to convince you that for large N almost all of the outcomes correspond to the macrostate "approximately half the molecules are on the left'. Background: Doing this by counting (as we did in class and Question 1.2) is too much work. Instead, we calculate the distributions. W values for (N molecules //k molecules on the left) are given by W=(Nk)=k!(Nk)!N!. The (Nk) values are called binomial coefficients or "combinations" Justification: Assume that all molecules are initially on the right. Number of ways to pick k molecules out of N and put them to the left: N(N1)(Nk+1)=N!/(Nk) ! BUT: This number is too large, because it assumes that the order of the k molecules matters. We don't care if we pick molecules 3/6/2 or 6/2/3, so the above number has to be divided by k ! Use the COMBIN(N,k) function in Excel. Remember that every probability distribution has to be normalized, i.e. kpk=1. The x-axes of all plots should cover the range 0 to NStep by Step Solution
There are 3 Steps involved in it
Step: 1

Get Instant Access to Expert-Tailored Solutions
See step-by-step solutions with expert insights and AI powered tools for academic success
Step: 2

Step: 3
Ace Your Homework with AI
Get the answers you need in no time with our AI-driven, step-by-step assistance
Get Started
Introduction To Chemical Engineering Analysis Using Mathematica
Authors: Henry C. Foley
1st Edition
0122619129, 978-0122619120