

Answered step by step
Verified Expert Solution
Question
1 Approved Answer
Please Show Work Alex hoids a portfolio that is imvested equally in three stocks. An analyst has used market- and firm-specific information to make expected
Please Show Work 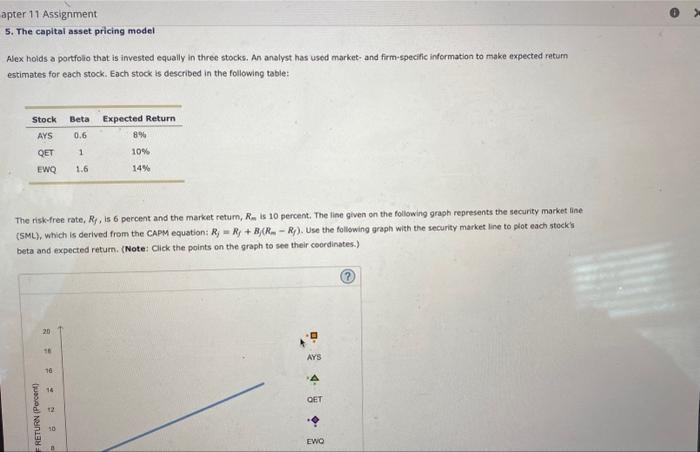
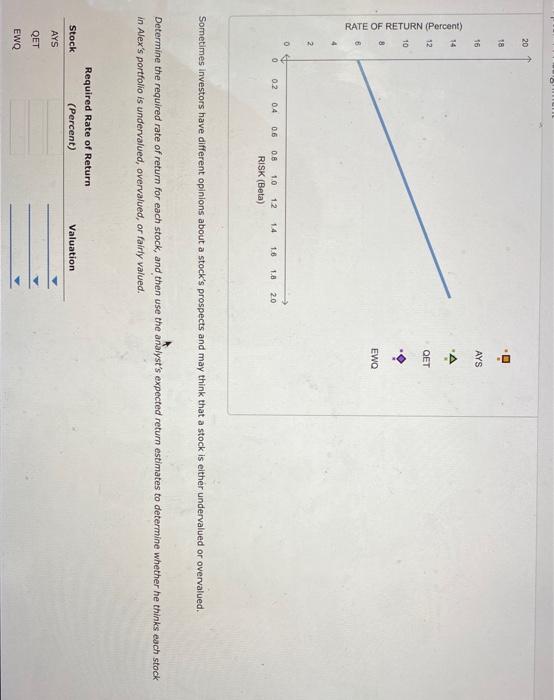
Alex hoids a portfolio that is imvested equally in three stocks. An analyst has used market- and firm-specific information to make expected retum estimates for each stock. Each stock is described in the following table: The risk-free rate, Rf, is 6 percent and the market retum, Rm is 10 percent. The line given on the following graph represents the security market line (5ML), which is derived from the CAPM equation: Rj=Rf+Bj(RmRf). Use the following graph with the security market. line to plot each stock's beta and expected retum. (Note: Click the points on the graph to see their coordinates.) Sometimes investors have different opinions about a stock's prospects and may think that a stock is either undervalued or overvalued. Determine the required rate of return for each stock, and then use the analyst's expected return estimates to determine whether he thinks each stock in Alex's portfolio is undervalued, overvalued, or fairly valued Step by Step Solution
There are 3 Steps involved in it
Step: 1

Get Instant Access to Expert-Tailored Solutions
See step-by-step solutions with expert insights and AI powered tools for academic success
Step: 2

Step: 3
Ace Your Homework with AI
Get the answers you need in no time with our AI-driven, step-by-step assistance
Get Started
The Pillars Of Finance The Misalignment Of Finance Theory And Investment Practice
Authors: G. Fraser-Sampson
2014th Edition
1137264055, 978-1137264053