please show work in excel
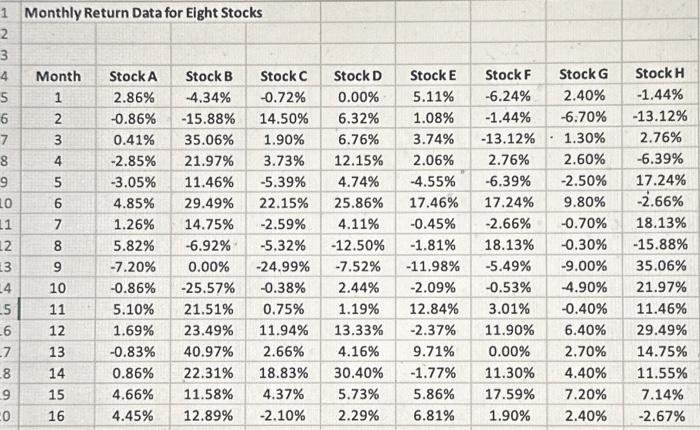
5. The Excel file Correlation Matrix Data contains monthly return data for eight (8) stocks. a. Compute the Correlation Matrix for the eight (8) stocks. b. Using EXCEL's Text Box feature explain/identify i. The characteristics of the Correlation Matrix. ii. What the correlation coefficient measures. iii. How the correlation coefficient values are used in portfolio theory, i.e., the role of the correlation coefficient in portfolio theory. \begin{tabular}{|c|c|c|c|c|c|c|c|c|} \hline \multicolumn{4}{|c|}{ Monthly Return Data for Eight Stocks } & & & & & \\ \hline & & & & & & & & \\ \hline & & - & & & & & & \\ \hline Month & Stock A & Stock B & Stock C & Stock D & StockE & Stock F & Stock G & Stock H \\ \hline 1 & 2.86% & 4.34% & 0.72% & 0.00% & 5.11% & 6.24% & 2.40% & 1.44% \\ \hline 2 & 0.86% & 15.88% & 14.50% & 6.32% & 1.08% & 1.44% & 6.70% & 13.12% \\ \hline 3 & 0.41% & 35.06% & 1.90% & 6.76% & 3.74% & 13.12% & 1.30% & 2.76% \\ \hline 4 & 2.85% & 21.97% & 3.73% & 12.15% & 2.06% & 2.76% & 2.60% & 6.39% \\ \hline 5 & 3.05% & 11.46% & 5.39% & 4.74% & 4.55% & 6.39% & 2.50% & 17.24% \\ \hline 6 & 4.85% & 29.49% & 22.15% & 25.86% & 17.46% & 17.24% & 9.80% & 2.66% \\ \hline 7 & 1.26% & 14.75% & 2.59% & 4.11% & 0.45% & 2.66% & 0.70% & 18.13% \\ \hline 8 & 5.82% & 6.92% & 5.32% & 12.50% & 1.81% & 18.13% & 0.30% & 15.88% \\ \hline 9 & 7.20% & 0.00% & 24.99% & 7.52% & 11.98% & 5.49% & 9.00% & 35.06% \\ \hline 10 & 0.86% & 25.57% & 0.38% & 2.44% & 2.09% & 0.53% & 4.90% & 21.97% \\ \hline 11 & 5.10% & 21.51% & 0.75% & 1.19% & 12.84% & 3.01% & 0.40% & 11.46% \\ \hline 12 & 1.69% & 23.49% & 11.94% & 13.33% & 2.37% & 11.90% & 6.40% & 29.49% \\ \hline 13 & 0.83% & 40.97% & 2.66% & 4.16% & 9.71% & 0.00% & 2.70% & 14.75% \\ \hline 14 & 0.86% & 22.31% & 18.83% & 30.40% & 1.77% & 11.30% & 4.40% & 11.55% \\ \hline 15 & 4.66% & 11.58% & 4.37% & 5.73% & 5.86% & 17.59% & 7.20% & 7.14% \\ \hline 16 & 4.45% & 12.89% & 2.10% & 2.29% & 6.81% & 1.90% & 2.40% & 2.67% \\ \hline \end{tabular}