

Answered step by step
Verified Expert Solution
Question
1 Approved Answer
Please show work on EXCEL!! What to do: (30 points) Please draw the Implied Volatility chart for ONE stock and TWO different maturity dates. You
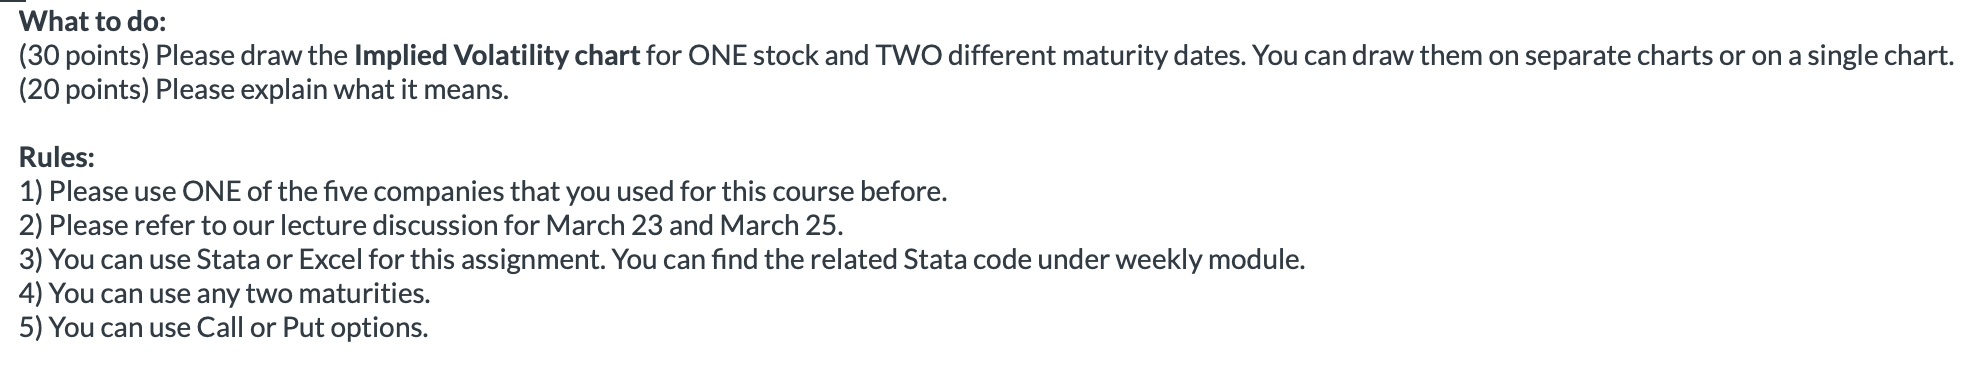 Please show work on EXCEL!!
Step by Step Solution
There are 3 Steps involved in it
Step: 1

Get Instant Access to Expert-Tailored Solutions
See step-by-step solutions with expert insights and AI powered tools for academic success
Step: 2

Step: 3
Ace Your Homework with AI
Get the answers you need in no time with our AI-driven, step-by-step assistance
Get Started
Personal Finance
Authors: E Thomas Garman, Raymond Forgue
11th Edition
1111531013, 9781111531010