

Answered step by step
Verified Expert Solution
Question
1 Approved Answer
please show work on xl please show what you pluged in on xl Review Formulas Data View Help File Draw Home Insert Home Page Layout
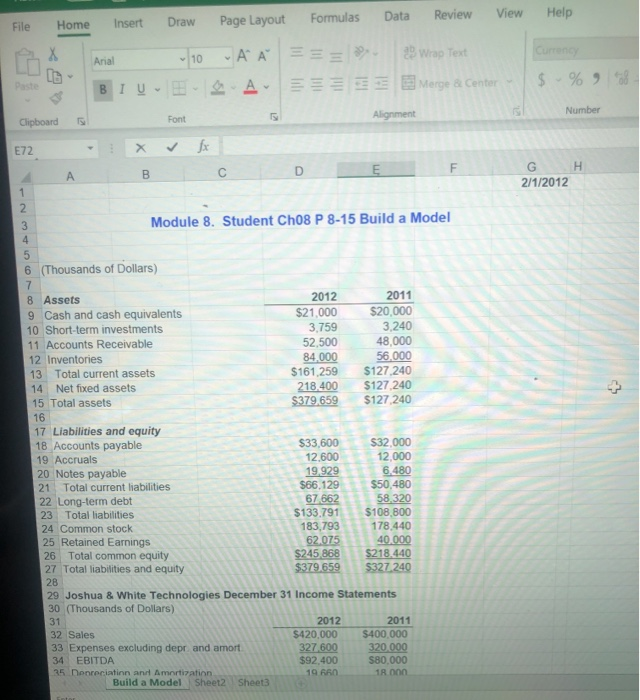
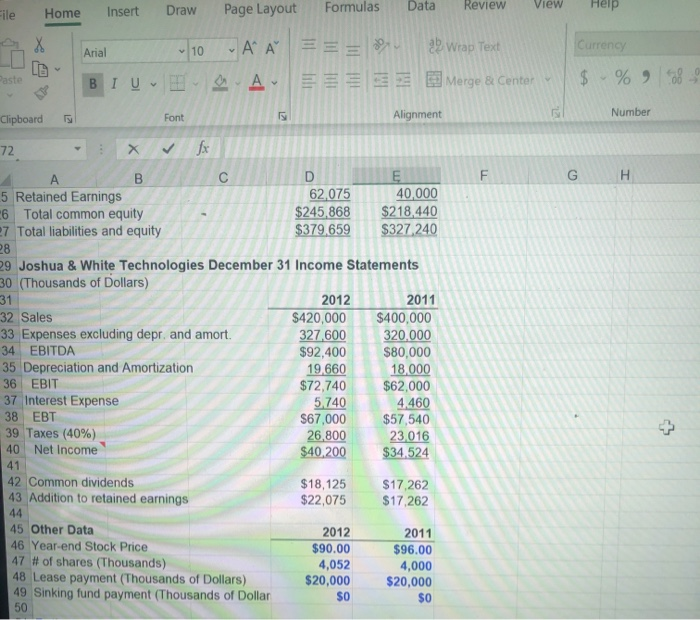
please show work on xl
please show what you pluged in on xl
Review Formulas Data View Help File Draw Home Insert Home Page Layout Arial Curreno AA E 10 29 Wrap Text Merge & Center a A- til BIU $ % 9 Alignment Number Clipboard Font G H 2/1/2012 00 OWN- 4 E72 fx B D F E 1 2 3 Module 8. Student Ch08 P 8-15 Build a Model 4 5 6 (Thousands of Dollars) 7 8 Assets 2012 2011 9 Cash and cash equivalents $21,000 $20,000 10 Short-term investments 3,759 3,240 11 Accounts Receivable 52,500 48,000 12 Inventories 84.000 56.000 13 Total current assets $161.259 $127.240 14 Net fixed assets 218,400 $127.240 15 Total assets $379 659 $127 240 16 17 Liabilities and equity 18 Accounts payable $33,600 $32,000 19 Accruals 12,600 12,000 20 Notes payable 19.929 6.480 21 Total current liabilities $66.129 $50,480 22 Long-term debt 67 662 58,320 23 Total liabilities $133.791 $108.800 24 Common stock 183,793 178,440 25 Retained Earnings 62.075 40.000 26 Total common equity $245 868 $218.440 27 Total liabilities and equity $379,659 $327.240 28 29 Joshua & White Technologies December 31 Income Statements 30 (Thousands of Dollars) 31 2012 2011 32 Sales $420,000 $400.000 33 Expenses excluding depr and amort 327 600 320.000 34 EBITDA $92,400 S80.000 35 Donreciatinn anul Amortization 19 PRO 18.00 Build a Model Sheet2 Sheets Insert Draw file Data Page Layout Home Formulas Review View Help X Arial 10 AA EE === ay Wrap Text Currency Paste BIU AE Merge & Center $ %98 Font 5 Clipboard Alignment Number 72 fx F G H B D 5 Retained Earnings 62,075 40,000 6 Total common equity $245,868 $218,440 7 Total liabilities and equity $379,659 $327 240 28 29 Joshua & White Technologies December 31 Income Statements 30 (Thousands of Dollars) 31 2012 2011 32 Sales $420,000 $400,000 33 Expenses excluding depr. and amort. 327,600 320,000 34 EBITDA $92,400 $80,000 35 Depreciation and Amortization 19,660 18,000 36 EBIT $72,740 $62,000 37 Interest Expense 5,740 4.460 38 EBT $67,000 $57,540 39 Taxes (40%) 26.800 23 016 40 Net Income $40 200 $34.524 41 42 Common dividends $18,125 $17.262 43 Addition to retained earnings $22,075 $17.262 44 45 Other Data 2012 2011 46 Year-end Stock Price $90.00 $96.00 47 # of shares (Thousands) 4,052 4,000 48 Lease payment (Thousands of Dollars) $20,000 $20,000 49 Sinking fund payment (Thousands of Dollar $0 SO 50 Home Insert Draw File Page Layout Formulas Data Review View Help Times New Roma 10 General - A Wrap Text A Merge & Center Paste BIU $ % Clipboard Font Alignment Numb G H 1107 > fu B D F 97 98 99 e. Perform a common size analysis. What has happened to the composition 100 (that is, percentage in each category) of assets and liabilities? 101 102 Common Size Balance Sheets 103 Assets 2012 2011 104 Cash and cash equivalents 105 Short-term investments 106 Accounts Receivable 107 Inventories 108 Total current assets 109 Net fixed assets 110 Total assets 111 112 Liabilities and equity 2012 2011 113 Accounts payable 114 Accruals 115 Notes payable 116 Total current liabilities 117 Long-term debt 118 Total liabilities 119 Common stock 120 Retained Earnings 121 Total common equity 122 Total liabilities and equity 123 124 Common Size Income Statements 2012 2011 125 Sales 126 Expenses excluding depr. and amort. 127 EBITDA 128 Depreciation and Amortization 129 EBIT 130 Interest Expense 1121 FRT Build a Model Sheet2 Sheet Ready FIN 432 module 8 ss O Search AutoSave ON Formulas Review Data View Help File Home Draw Insert Page Layout X General Times New Roma v 10 AA == B TUCA 2 Wrap Text 3 Merge & Center V Paste $ % Nur Clipboard Font 22 Alignment 1107 > D E F G 2012 2011 A B 09 Net fixed assets 10 Total assets 11 12 Liabilities and equity 13 Accounts payable 14 Accruals 115 Notes payable 16 Total current liabilities 117 Long-term debt 118 Total liabilities 119 Common stock 120 Retained Earnings 121 Total common equity 122 Total liabilities and equity 123 124 Common Size Income Statements 125 Sales 126 Expenses excluding depr. and amort. 127 EBITDA 128 Depreciation and Amortization 129 EBIT 130 Interest Expense 131 EBT 132 Taxes (40%) 133 Net Income 134 135 136 137 138 139 1. Perform a percent 10 2012 2011 Review Formulas Data View Help File Draw Home Insert Home Page Layout Arial Curreno AA E 10 29 Wrap Text Merge & Center a A- til BIU $ % 9 Alignment Number Clipboard Font G H 2/1/2012 00 OWN- 4 E72 fx B D F E 1 2 3 Module 8. Student Ch08 P 8-15 Build a Model 4 5 6 (Thousands of Dollars) 7 8 Assets 2012 2011 9 Cash and cash equivalents $21,000 $20,000 10 Short-term investments 3,759 3,240 11 Accounts Receivable 52,500 48,000 12 Inventories 84.000 56.000 13 Total current assets $161.259 $127.240 14 Net fixed assets 218,400 $127.240 15 Total assets $379 659 $127 240 16 17 Liabilities and equity 18 Accounts payable $33,600 $32,000 19 Accruals 12,600 12,000 20 Notes payable 19.929 6.480 21 Total current liabilities $66.129 $50,480 22 Long-term debt 67 662 58,320 23 Total liabilities $133.791 $108.800 24 Common stock 183,793 178,440 25 Retained Earnings 62.075 40.000 26 Total common equity $245 868 $218.440 27 Total liabilities and equity $379,659 $327.240 28 29 Joshua & White Technologies December 31 Income Statements 30 (Thousands of Dollars) 31 2012 2011 32 Sales $420,000 $400.000 33 Expenses excluding depr and amort 327 600 320.000 34 EBITDA $92,400 S80.000 35 Donreciatinn anul Amortization 19 PRO 18.00 Build a Model Sheet2 Sheets Insert Draw file Data Page Layout Home Formulas Review View Help X Arial 10 AA EE === ay Wrap Text Currency Paste BIU AE Merge & Center $ %98 Font 5 Clipboard Alignment Number 72 fx F G H B D 5 Retained Earnings 62,075 40,000 6 Total common equity $245,868 $218,440 7 Total liabilities and equity $379,659 $327 240 28 29 Joshua & White Technologies December 31 Income Statements 30 (Thousands of Dollars) 31 2012 2011 32 Sales $420,000 $400,000 33 Expenses excluding depr. and amort. 327,600 320,000 34 EBITDA $92,400 $80,000 35 Depreciation and Amortization 19,660 18,000 36 EBIT $72,740 $62,000 37 Interest Expense 5,740 4.460 38 EBT $67,000 $57,540 39 Taxes (40%) 26.800 23 016 40 Net Income $40 200 $34.524 41 42 Common dividends $18,125 $17.262 43 Addition to retained earnings $22,075 $17.262 44 45 Other Data 2012 2011 46 Year-end Stock Price $90.00 $96.00 47 # of shares (Thousands) 4,052 4,000 48 Lease payment (Thousands of Dollars) $20,000 $20,000 49 Sinking fund payment (Thousands of Dollar $0 SO 50 Home Insert Draw File Page Layout Formulas Data Review View Help Times New Roma 10 General - A Wrap Text A Merge & Center Paste BIU $ % Clipboard Font Alignment Numb G H 1107 > fu B D F 97 98 99 e. Perform a common size analysis. What has happened to the composition 100 (that is, percentage in each category) of assets and liabilities? 101 102 Common Size Balance Sheets 103 Assets 2012 2011 104 Cash and cash equivalents 105 Short-term investments 106 Accounts Receivable 107 Inventories 108 Total current assets 109 Net fixed assets 110 Total assets 111 112 Liabilities and equity 2012 2011 113 Accounts payable 114 Accruals 115 Notes payable 116 Total current liabilities 117 Long-term debt 118 Total liabilities 119 Common stock 120 Retained Earnings 121 Total common equity 122 Total liabilities and equity 123 124 Common Size Income Statements 2012 2011 125 Sales 126 Expenses excluding depr. and amort. 127 EBITDA 128 Depreciation and Amortization 129 EBIT 130 Interest Expense 1121 FRT Build a Model Sheet2 Sheet Ready FIN 432 module 8 ss O Search AutoSave ON Formulas Review Data View Help File Home Draw Insert Page Layout X General Times New Roma v 10 AA == B TUCA 2 Wrap Text 3 Merge & Center V Paste $ % Nur Clipboard Font 22 Alignment 1107 > D E F G 2012 2011 A B 09 Net fixed assets 10 Total assets 11 12 Liabilities and equity 13 Accounts payable 14 Accruals 115 Notes payable 16 Total current liabilities 117 Long-term debt 118 Total liabilities 119 Common stock 120 Retained Earnings 121 Total common equity 122 Total liabilities and equity 123 124 Common Size Income Statements 125 Sales 126 Expenses excluding depr. and amort. 127 EBITDA 128 Depreciation and Amortization 129 EBIT 130 Interest Expense 131 EBT 132 Taxes (40%) 133 Net Income 134 135 136 137 138 139 1. Perform a percent 10 2012 2011 Step by Step Solution
There are 3 Steps involved in it
Step: 1

Get Instant Access to Expert-Tailored Solutions
See step-by-step solutions with expert insights and AI powered tools for academic success
Step: 2

Step: 3
Ace Your Homework with AI
Get the answers you need in no time with our AI-driven, step-by-step assistance
Get Started
Cost Management Accounting And Control
Authors: Don R. Hansen, Maryanne Mowen
2nd Edition
0538864451, 978-0538864459