Please show work possible. Thank you very much.
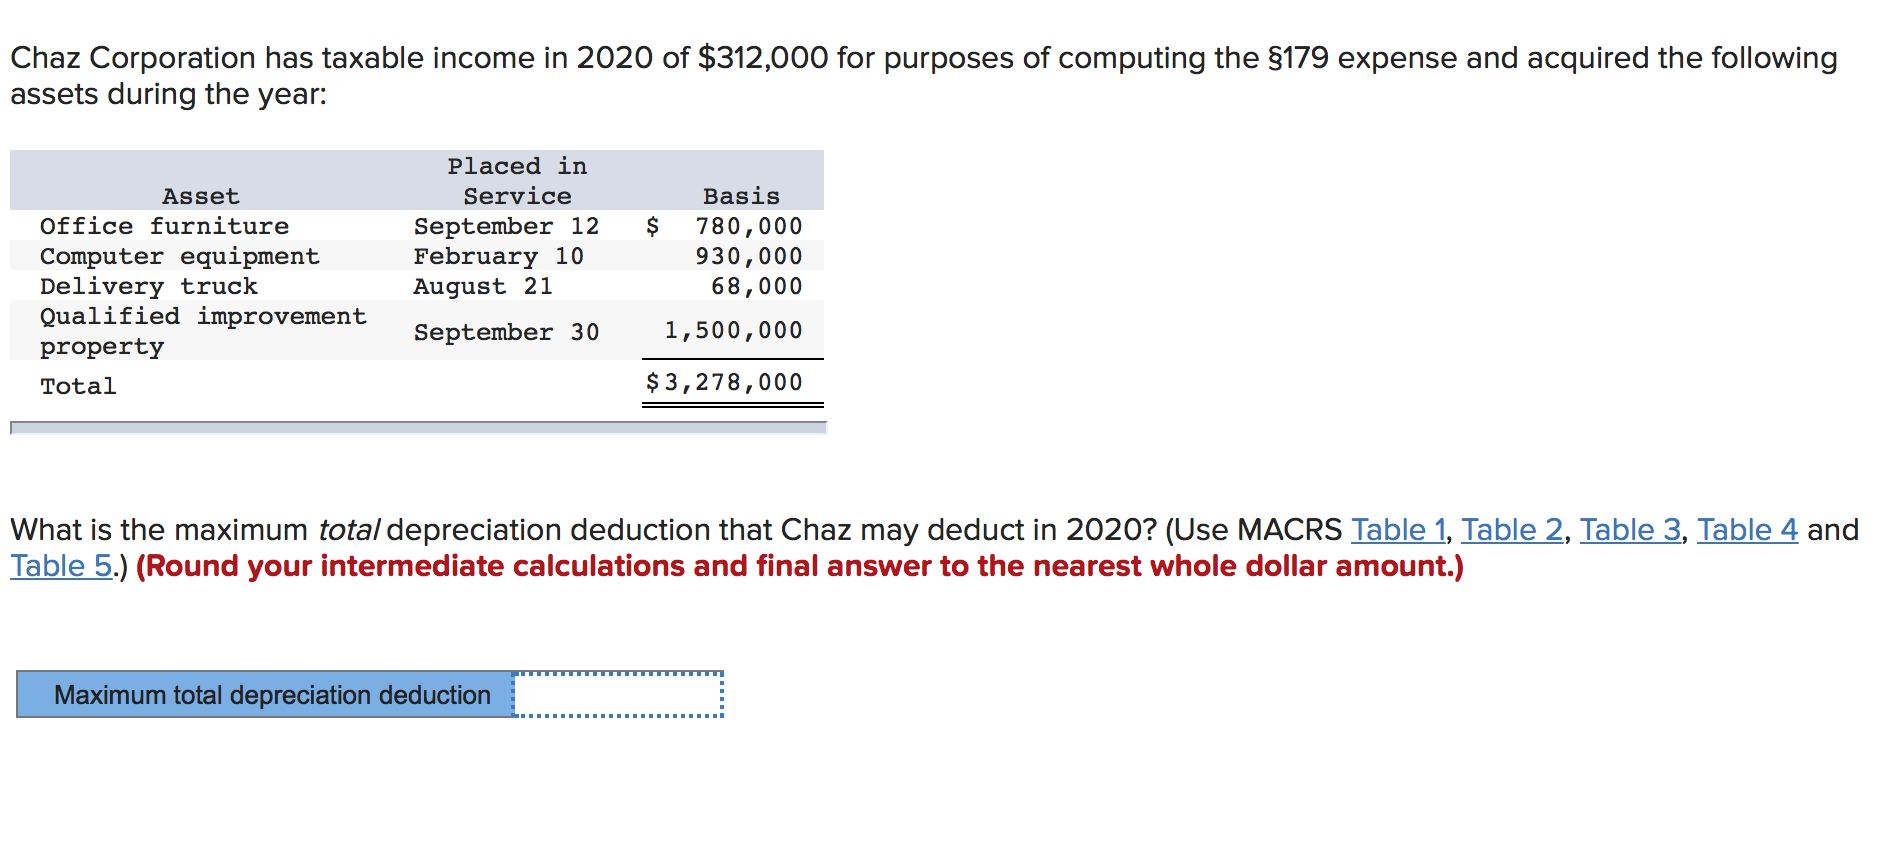
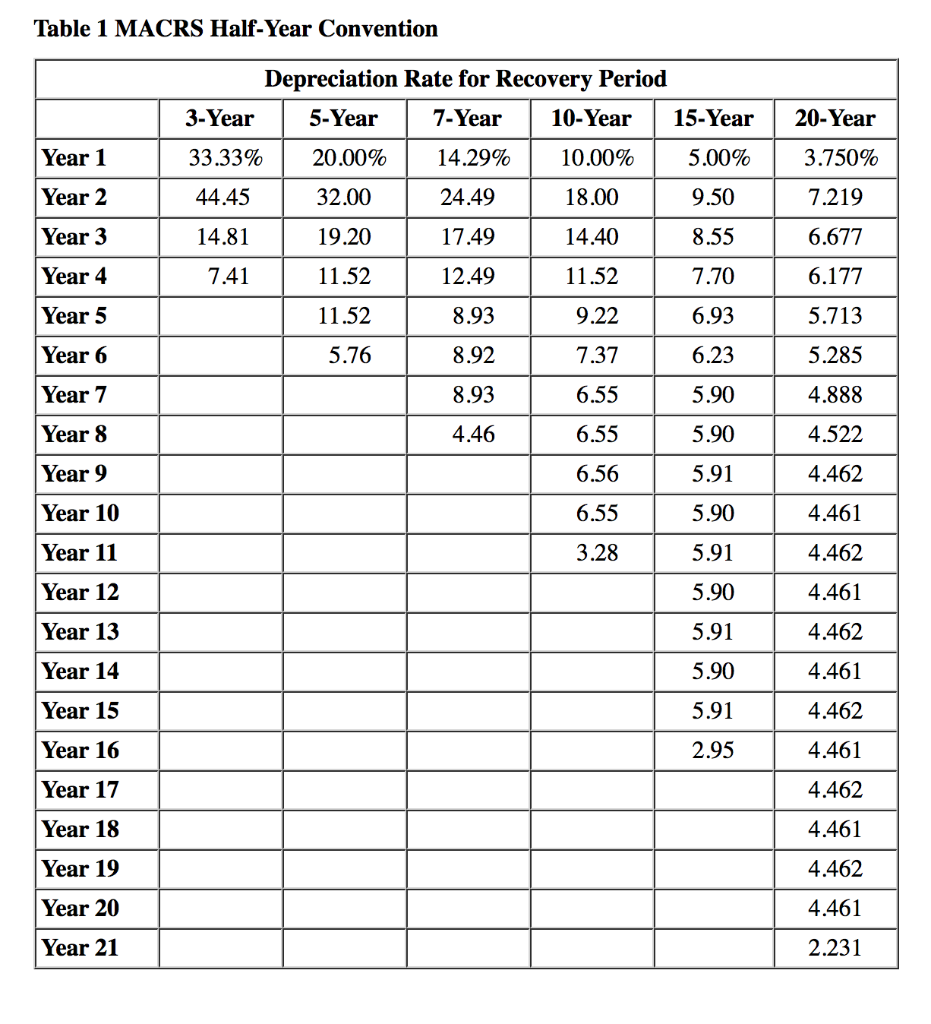
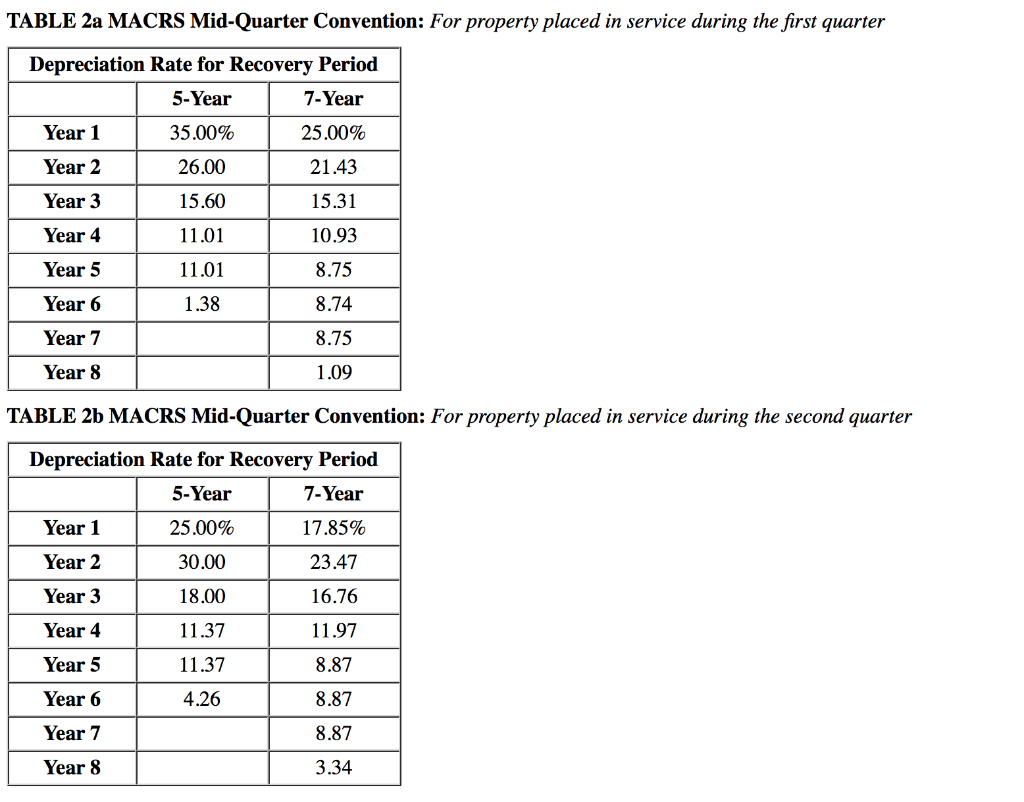
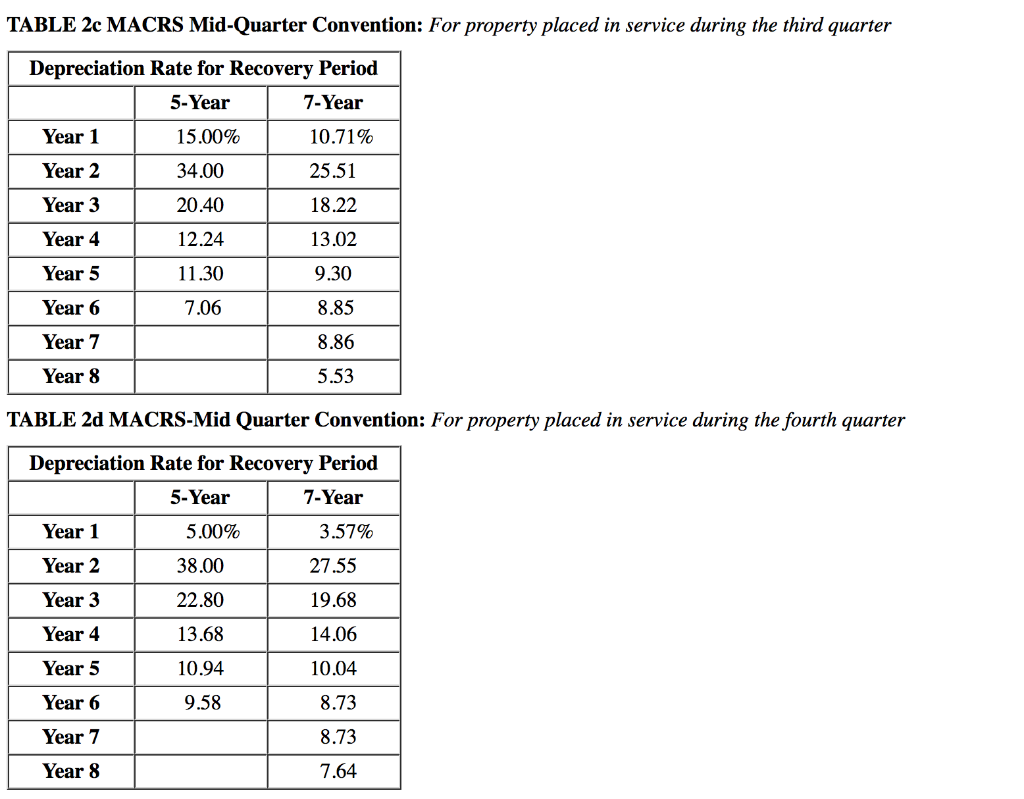
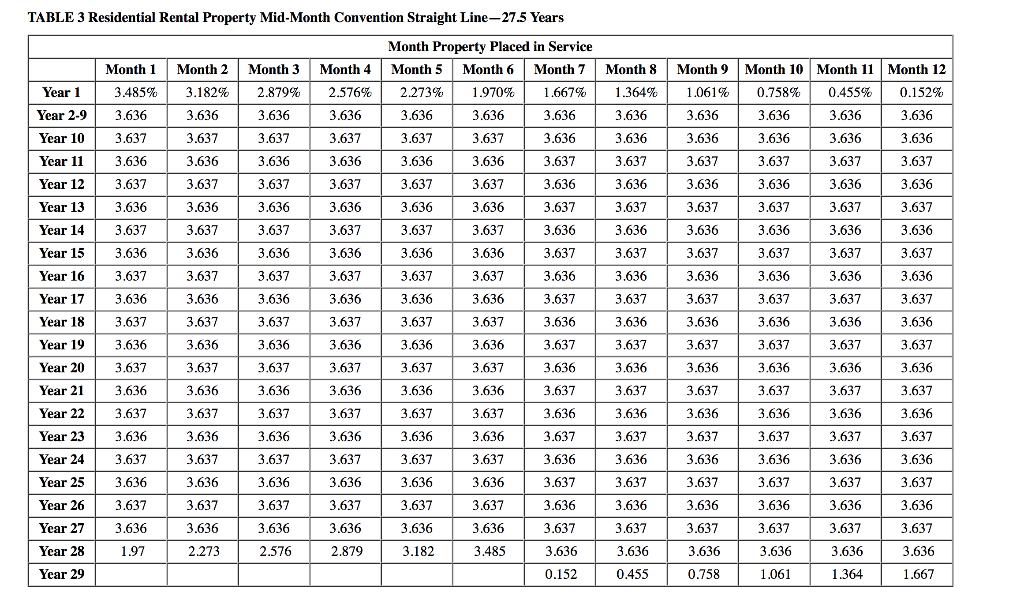 TABLE 4 Nonresidential Real Property Mid-Month Convention Straight Line31.5 Years (for assets placed in service before May 13, 1993)
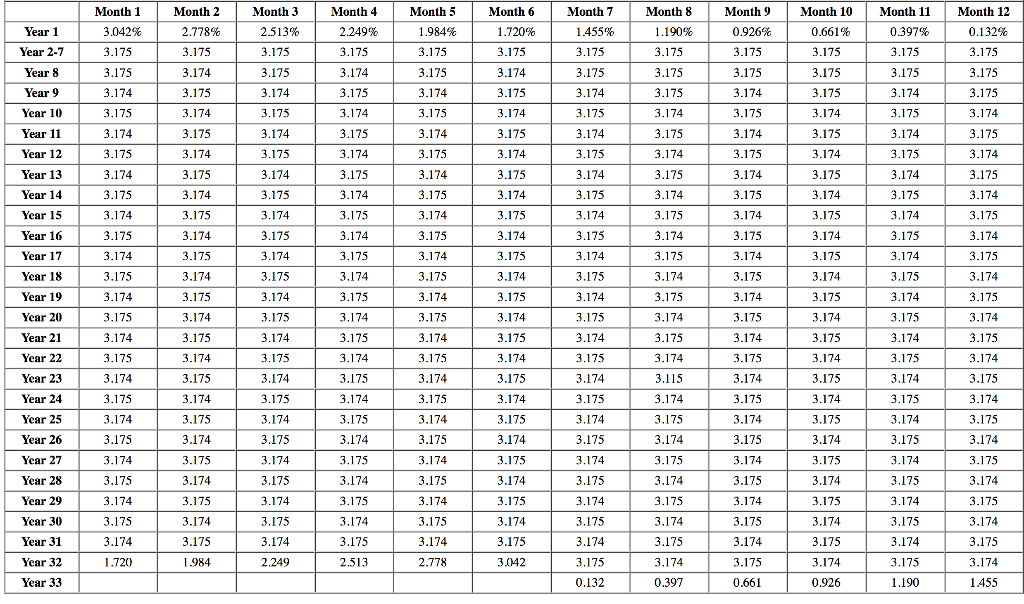
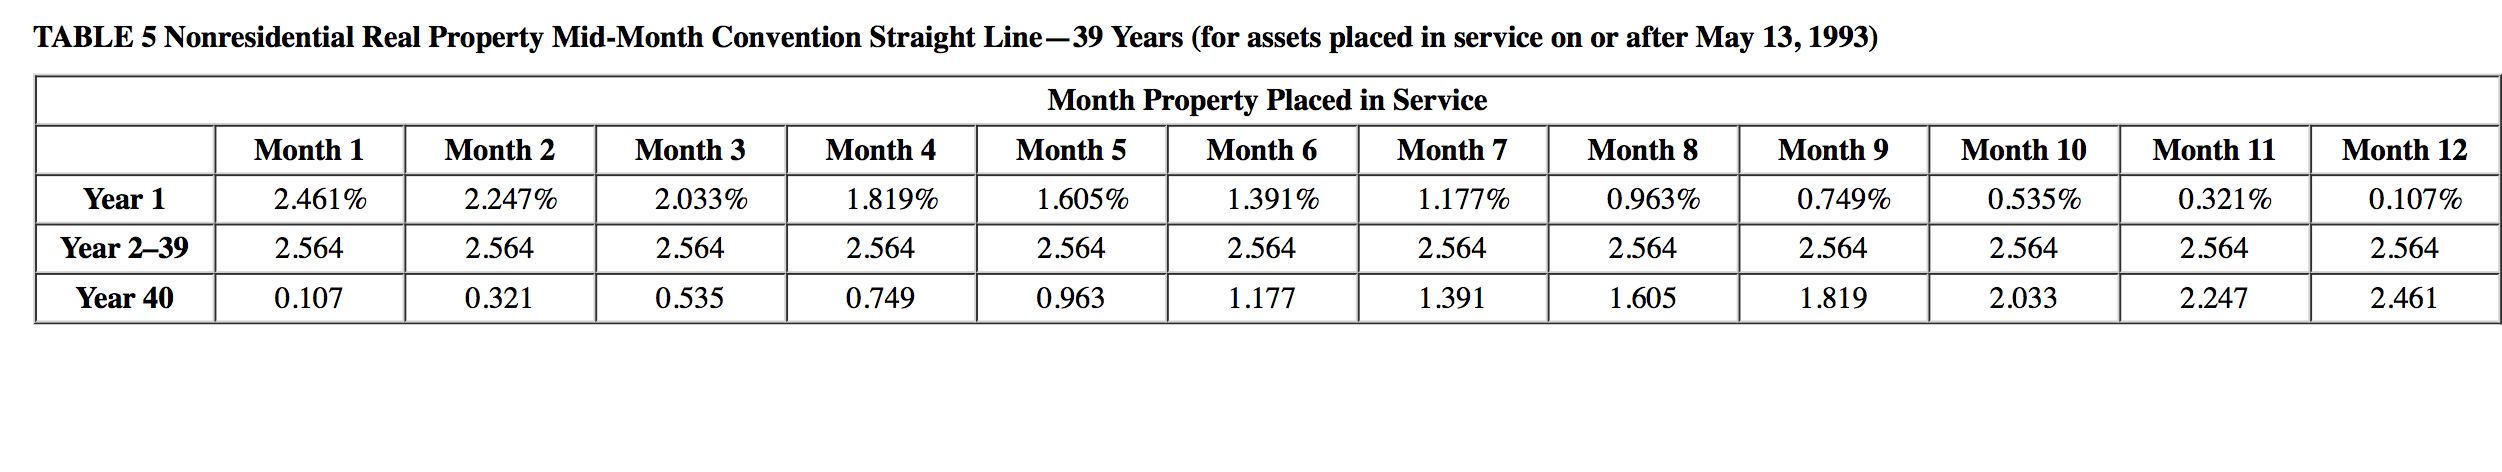
Chaz Corporation has taxable income in 2020 of $312,000 for purposes of computing the $179 expense and acquired the following assets during the year: Asset Office furniture Computer equipment Delivery truck Qualified improvement property Total Placed in Service September 12 February 10 August 21 Basis $ 780,000 930,000 68,000 1,500,000 September 30 $3,278,000 What is the maximum total depreciation deduction that Chaz may deduct in 2020? (Use MACRS Table 1, Table 2, Table 3, Table 4 and Table 5.) (Round your intermediate calculations and final answer to the nearest whole dollar amount.) Maximum total depreciation deduction Table 1 MACRS Half-Year Convention Depreciation Rate for Recovery Period 3-Year 5-Year 7-Year 10-Year 15-Year 20-Year Year 1 33.33% 20.00% 14.29% 10.00% 5.00% 3.750% Year 2 44.45 32.00 24.49 18.00 9.50 7.219 Year 3 14.81 19.20 17.49 14.40 8.55 6.677 Year 4 7.41 11.52 12.49 11.52 7.70 6.177 Year 5 11.52 8.93 9.22 6.93 5.713 Year 6 5.76 8.92 7.37 6.23 5.285 Year 7 8.93 6.55 5.90 4.888 Year 8 4.46 6.55 5.90 4.522 Year 9 6.56 5.91 4.462 Year 10 6.55 5.90 4.461 Year 11 3.28 5.91 4.462 Year 12 5.90 4.461 Year 13 5.91 4.462 Year 14 5.90 4.461 Year 15 5.91 4.462 Year 16 2.95 4.461 Year 17 4.462 Year 18 4.461 4.462 Year 19 Year 20 4.461 Year 21 2.231 TABLE 2a MACRS Mid-Quarter Convention: For property placed in service during the first quarter Depreciation Rate for Recovery Period 5-Year 7-Year Year 1 35.00% 25.00% Year 2 26.00 21.43 Year 3 15.60 15.31 Year 4 11.01 10.93 Year 5 11.01 8.75 Year 6 1.38 8.74 Year 7 8.75 Year 8 1.09 TABLE 26 MACRS Mid-Quarter Convention: For property placed in service during the second quarter Depreciation Rate for Recovery Period 5-Year 7-Year Year 1 25.00% 17.85% Year 2 30.00 23.47 16.76 Year 3 18.00 Year 4 11.37 11.97 Year 5 11.37 8.87 Year 6 4.26 8.87 Year 7 8.87 Year 8 3.34 TABLE 2c MACRS Mid-Quarter Convention: For property placed in service during the third quarter Depreciation Rate for Recovery Period 5-Year 7-Year Year 1 15.00% 10.71% Year 2 34.00 25.51 Year 3 20.40 18.22 Year 4 12.24 13.02 Year 5 11.30 9.30 Year 6 7.06 8.85 Year 7 8.86 Year 8 5.53 TABLE 20 MACRS-Mid Quarter Convention: For property placed in service during the fourth quarter Depreciation Rate for Recovery Period 5-Year 7-Year Year 1 5.00% 3.57% Year 2 38.00 27.55 Year 3 22.80 19.68 Year 4 13.68 14.06 Year 5 10.94 10.04 Year 6 9.58 8.73 Year 7 8.73 Year 8 7.64 TABLE 3 Residential Rental Property Mid-Month Convention Straight Line-27.5 Years Month 3 Month 1 3.485% 3.636 Month 2 3.182% Month 8 1.364% 2.879% 3.636 3.636 3.636 3.636 3.637 3.637 3.637 Month 9 1.061% 3.636 3.636 3.637 3.636 3.637 3.636 3.636 3.637 3.637 3.636 3.637 3.637 3.636 Month 10 Month 11 Month 12 0.758% 0.455% 0.152% 3.636 3.636 3.636 3.636 3.636 3.636 3.637 3.637 3,637 3.636 3.636 3.636 3.637 3.637 3.637 3.636 3.636 3.636 3.637 3.637 3.637 3.636 3.636 3.636 Year 1 Year 2-9 Year 10 Year 11 Year 12 Year 13 Year 14 Year 15 Year 16 Year 17 Year 18 Year 19 Year 20 3.636 3.636 3.637 3.636 3.637 3.636 3.637 3.637 3.637 3.636 3.636 3.636 3.637 3.637 3.637 3.636 3.636 3.637 3.636 Month Property Placed in Service Month 4 Month 5 Month 6 Month 7 2.576% 2.273% 1.970% 1.667% 3.636 3.636 3.636 3.636 3.637 3.637 3.637 3.636 3.636 3.636 3.636 3.637 3.637 3.637 3.637 3.636 3.636 3.636 3.636 3.637 3.637 3.637 3.637 3.636 3.636 3.636 3.636 3.637 3.637 3.637 3.637 3.636 3.636 3.636 3.636 3.637 3.637 3.637 3.637 3.636 3.636 3.636 3.636 3.637 3.637 3.637 3.637 3.636 3.636 3.636 3.636 3.637 3.637 3.637 3.637 3.636 3.636 3.636 3.636 3.637 3.637 3.637 3.637 3.636 3.636 3.636 3.636 3.637 3.637 3.637 3.637 3.636 3.636 3.636 3.636 3.637 2.879 3.182 3.485 3.636 3.637 3.637 3.636 3.637 3.636 3.637 3.636 3.637 3.636 3.637 3.636 3.637 3,636 3.636 3.636 3.636 3.637 3.636 3.637 3.636 3.637 3.636 3.637 3.636 3.637 3.637 3.637 3.637 3.636 3.637 3.636 3.636 Year 21 3.636 3.636 3.637 3.637 3.637 3.636 3.637 3.636 3.637 3.637 3.636 Year 22 3.637 3.637 3.636 3.636 3.637 3.636 3.636 3.637 3.636 3.636 3.637 3.637 3.637 3.636 3.637 3.637 3.636 3.637 3.636 3.636 3.637 3.636 3.637 3.636 3.637 3.636 3.637 3.637 Year 23 Year 24 Year 25 Year 26 Year 27 Year 28 Year 29 3.636 3.637 3.637 3.637 3.636 3.636 3.636 3.636 3.636 3.637 3.637 3.637 3.636 1.97 3.636 2.576 3.636 3.637 3.636 3.637 3.636 2.273 3.636 3.636 3.636 0.758 0.152 0.455 1.061 1.364 1.667 Month 2 Month 5 Month 6 Month 8 Month 1 3.042% Month 3 2.513% Month 4 2.249% Year 1 Month 10 0.661% 2.778% 1.984% Month 7 1.455% 3.175 1.720% 3.175 1.190% Month 9 0.926% 3.175 Month 11 0.397% 3.175 3.175 Month 12 0.132% 3.175 Year 2-7 3.175 3.175 3.175 3.175 3.175 3.174 3.175 3.175 3.175 3.174 3.175 3.174 3.175 3.174 3.175 3.174 3.175 3.174 3.175 3.175 3.174 3.175 3.175 3.175 3.174 3.175 3.174 3.175 3.175 3.175 3.174 3.175 3.175 3.174 3.175 3.175 3.174 Year 8 Year 9 Year 10 Year 11 Year 12 Year 13 Year 14 3.174 3.175 3.174 3.175 3.174 3.174 3.175 3.174 3.174 3.175 3.175 3.174 3.174 3.175 3.174 3.175 3.175 3.174 3.175 3.175 3.174 3.174 3.175 3.174 3.174 3.175 3.174 3.174 3.175 3.174 3.175 3.174 3.174 3.175 3.175 3.174 3.175 3.174 3.174 3.175 3.174 3.175 3.174 3.175 3.174 3.175 3.174 3.175 3.174 3.175 3.175 3.175 3.175 3.174 3.174 Year 15 3.175 3.175 3.174 3.175 3.174 3.175 3.174 3.175 3.174 3.175 Year 16 3.175 3.174 3.175 3.174 3.175 3.174 3.175 3.174 3.175 3.174 3.175 3.174 Year 17 3.174 3.175 3.174 3.175 3.174 3.175 3.174 3.175 3.174 3.175 3.175 3.174 3.175 3.175 3.174 3.175 3.174 3.175 3.174 3.174 3.175 3.174 3.174 Year 18 Year 19 Year 20 3.175 3.174 3.175 3.174 3.175 3.174 3.174 3.175 3.174 3.175 3.175 3.174 3.174 3.175 3.175 3.174 3.174 3.175 3.174 3.175 3.175 3.175 3.174 3.175 3.174 3.175 3.174 3.17 3.174 3.175 3.174 3.175 3.174 Year 21 Year 22 Year 23 3.174 3.175 3.175 3.174 3.175 3.174 3.174 3.174 3.175 3.174 3.175 3.174 3.175 3.174 3.174 3.175 3.174 3.175 3.174 3.175 3.175 3.175 3.174 3.115 3.175 3.174 3.175 3.174 3.175 3.175 3.174 Year 24 3.175 3.174 3.175 3.174 3.175 3.174 3.175 3.174 3.175 3.174 3.175 3.174 3.175 Year 25 3.175 3.174 3.175 3.174 3.175 3.174 3.174 3.175 3.175 3.174 3.174 3.175 3.174 3.175 3.174 3.175 3.174 3.174 3.174 3.175 3.174 3.175 3.174 3.175 3.174 3.175 3.174 3.174 3.175 3.174 3.175 3.175 3.174 3.175 3.174 3.174 3.175 3.175 3.174 3.175 3.175 3.174 3.175 3.174 Year 26 Year 27 Year 28 Year 29 Year 30 Year 31 Year 32 3.174 3.175 3.174 3.175 3.174 3.175 3.175 3.174 3.174 3.175 3.175 3.174 3.174 3.175 3.174 3.175 3.175 3.175 3.174 3.175 3.174 2.249 3.174 3.175 3.174 3.175 3.174 3,175 3.174 3.175 3.174 3.175 3.174 3.175 3.174 3.175 3.175 1.984 3.174 1.720 2.513 2.778 3.042 3.175 3.174 3.174 3.174 0.397 3.175 1.190 Year 33 0.132 0.661 0.926 1.455 TABLE 5 Nonresidential Real Property Mid-Month Convention Straight Line39 Years (for assets placed in service on or after May 13, 1993) Month Property Placed in Service Month 5 Month 6 Month 7 Month 1 Month 2 Month 3 Month 4 Month 8 Month 9 Month 10 Month 11 Month 12 Year 1 2.461% 2.247% 2.033% 1.819% 1.605% 1.391% 1.177% 0.963% 0.749% 0.321% 0.107% 0.535% 2.564 Year 2-39 2.564 2.564 2.564 2.564 2.564 2.564 2.564 2.564 2.564 2.564 2.564 Year 40 0.107 0.321 0.535 0.749 0.963 1.177 1.391 1.605 1.819 2.033 2.247 2.461