

Answered step by step
Verified Expert Solution
Question
1 Approved Answer
please show work Problem 6: The table below shows the Actual demand and forecast for 12 periods of data. Calculate the Cumulative Forecast Error and
please show work 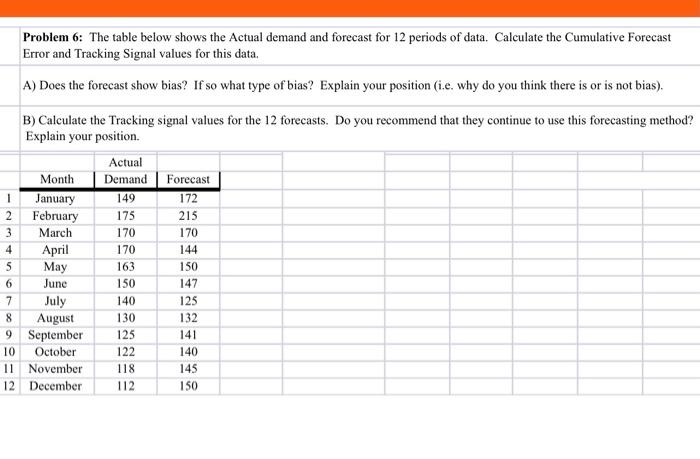 Problem 6: The table below shows the Actual demand and forecast for 12 periods of data. Calculate the Cumulative Forecast Error and Tracking Signal values for this data, A) Does the forecast show bias? If so what type of bias? Explain your position (i.e. why do you think there is or is not bias), B) Calculate the Tracking signal values for the 12 forecasts. Do you recommend that they continue to use this forecasting method? Explain your position. Actual Month Demand Forecast 1 January 149 172 2 February 175 215 3 March 170 170 4 April 170 144 5 May 163 150 6 June 150 147 7 July 140 125 8 August 130 132 9 September 125 141 10 October 122 140 11 November 118 145 12 December 112 150
please show work
Step by Step Solution
There are 3 Steps involved in it
Step: 1

Get Instant Access to Expert-Tailored Solutions
See step-by-step solutions with expert insights and AI powered tools for academic success
Step: 2

Step: 3
Ace Your Homework with AI
Get the answers you need in no time with our AI-driven, step-by-step assistance
Get Started
Marketing Theory And Practice
Authors: Michael J. Baker
1st Edition
1349068555, 9781349068531