Answered step by step
Verified Expert Solution
Question
1 Approved Answer
please show work The comparative financial statements for Prince Company are below Year 1 Year 2 Income statement Sales revenue Cost of goods sold Gross
please show work
The comparative financial statements for Prince Company are below Year 1 Year 2 Income statement Sales revenue Cost of goods sold Gross profit Operating expenses and interest expense Pretax income Income tax Net income Balance sheet $194,000 $ 168,000 100,400 67,600 56,400 24,600 8,400 14.400 4,200 16,200 S 10200 $ 4,400 $ 7200 Accounts receivable (net) Property and equipment (net) Total assets Current liabilities (no interest) Long-term liabilities (10% interest) Common stock ($5 par value, 6,200 shares outstanding) Retained earnings Total liabilities and stockholders equity 45,600 $ 104,600 16,200 38,400 $ 98,600 $ 17,200 45,200 5,200 $ 98,600 04,600 PRINCE COMPANY Balance Sheet At December 31, Year 2 Component Percentages Year2 Accounts receivable (net) Property and equipment (net) Total assets (the base amount) Long-term liabilities (10% interest) Common stock ($5 par value, 6,200 shares outstanding) Retained earnings Total liabilities and owners' equity (the base amount) 1. Compute component percentages for Year 2. (Enter your answer as a percentage rounded to 2 decimal places (i.e. 0.1234 PRINCE COMPANY Income Statement At December 31, Year Component Percentages Year 2 Sales revenue (the base amount) 100.001%
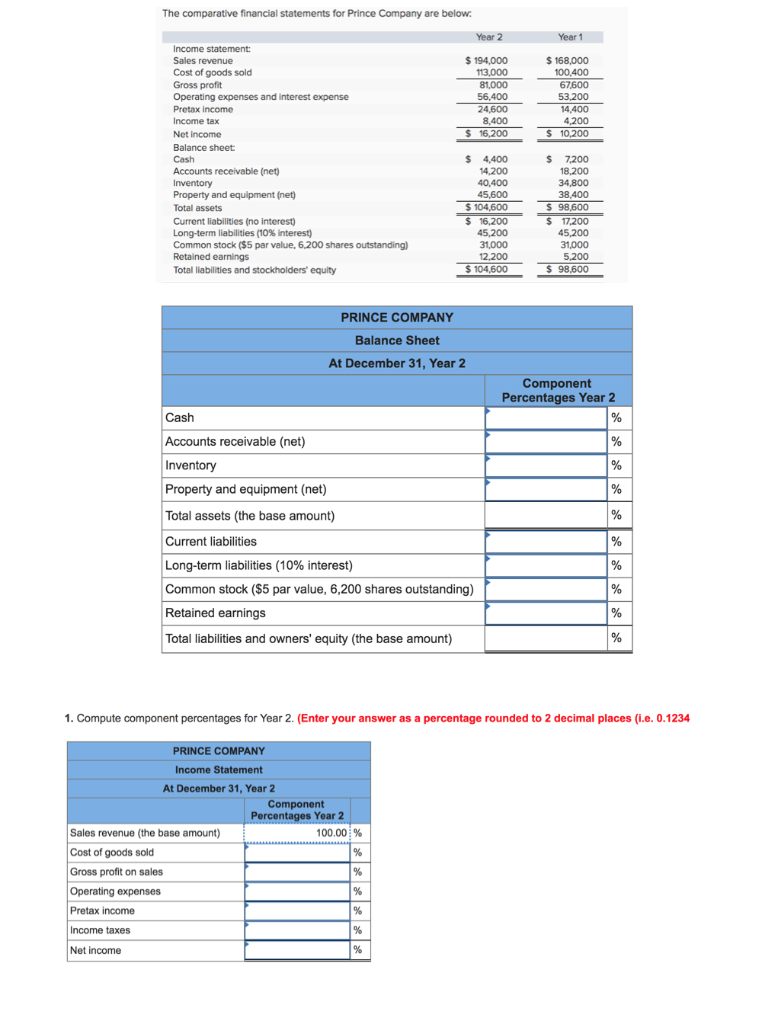
Step by Step Solution
There are 3 Steps involved in it
Step: 1
Get Instant Access to Expert-Tailored Solutions
See step-by-step solutions with expert insights and AI powered tools for academic success
Step: 2
Step: 3
Ace Your Homework with AI
Get the answers you need in no time with our AI-driven, step-by-step assistance
Get Started