

Question
Please show work to understand it. Thank you! In mid-2009, Chem-Med commenced the manufacture and distribution of its first product, VISCAM, which is used to
Please show work to understand it. Thank you!
In mid-2009, Chem-Med commenced the manufacture and distribution of its first product, VISCAM, which is used to hold tissues in place during and after surgery of the retina. In late 2010, Chem-Med received regulatory approval to market another HA product known as VISCHY, which is used for the treatment of degenerative joint diseases in horses. The two products, VISCHAM and VISCHY, are the only ones Chem-Med currently produces; however, the company has an active R&D program that is currently investigating other applications.
There are only two other manufacturers of FDA-approved HA products in the world: AB Fortia, a Swedish corporation, which manufactures a product called Healon in Sweden and distributes it in the United States through a subsidiary, Pharmacia, Inc.; and Cilco, Inc., of Huntington, West Virginia. Chem-Med has about a 25 percent share of the market (for HA products in eye surgery) against Cilcos 16 percent and Pharmacias 59 percent. Pharmacia, with the power of giant AB Fortia behind it, waged a continuing marketing war with Chem-Med, undercutting Chem-Meds prices and wooing its costumers away at every opportunity. The matter came to a head in September, when Chem-Med filed a $13 million suit against Pharmacia, charging unfair trade practices. Dr. Swan was reasonably confident that Chem-Med would prevail in the suit, and, in fact, Pharmacia had recently offered to settle out of court for $500,000.
Dr. Swans primary problem, he said, was that, although he was convinced the company was sound and would grow, he wasnt sure how to communicate that to potential investors in the financial community in a way that would convince them. Just handing out past income statements and balance sheets that he received from the accountants didnt seem to be enough. Further, he wasnt even sure the company needed outside financing, let alone how much. He just felt that they would need it, since they had always had to ask for money in the past.
Dr. Swan had lunch with his banker just recently, and the banker mentioned several restrictive covenants that the company would have to meet if it came to the bank for financing. Dr. Swan pulled a sheet of paper from his desk drawer and glanced at it. There were three covenants listed:
- The current ratio must be maintained above 2.25 to 1.
- The debt-to-assets ratio must be less than .3 to 1.
- Dividends cannot be paid unless earnings are positive.
Dr. Swan didnt think he would have any trouble with those, but he wasnt sure. Then he suddenly remembered he was supposed to meet a representative from one of the local supermarket chains (who supplied Chem-Med with rooster combs) in five minutes. He hurriedly put his papers away and wished he had more time to analyze the numbers before the next board of directors meeting. (The financial information is presented in Figures 1, 2, and 3.)
You are an investor who is considering adding Chem-Med to your portfolio. As such, you are interested in the companys record of profitability, prospects for the future, degree of risk, and how it compares with others in the industry. From that point of view, answer the following questions:
4.) What is Chem-Meds total debt-to-assets ratio for 2015, 2016, 2017, 2018? Is any trend evident in the four-year period? Does Chem-Med in 2015 have more or less debt than the average company in the industry?
5.) What is Chem-Meds average accounts receivable collection period for 2015, 2016, 2017, 2018? Is the period getting longer or shorter? What are the consequences?
6.)How does Chem-Meds return-on-equity ratio (ROE) compare to Pharmacias and the industry for 2015? Using the Du Pont method, compare the positions of Chem-Med and Pharmacia. Compute ROE for each company using the following formula:
ROE = Profit margin Asset turnover/(1Debt to assets)
Compare the results to determine the sources of ROE for each company.
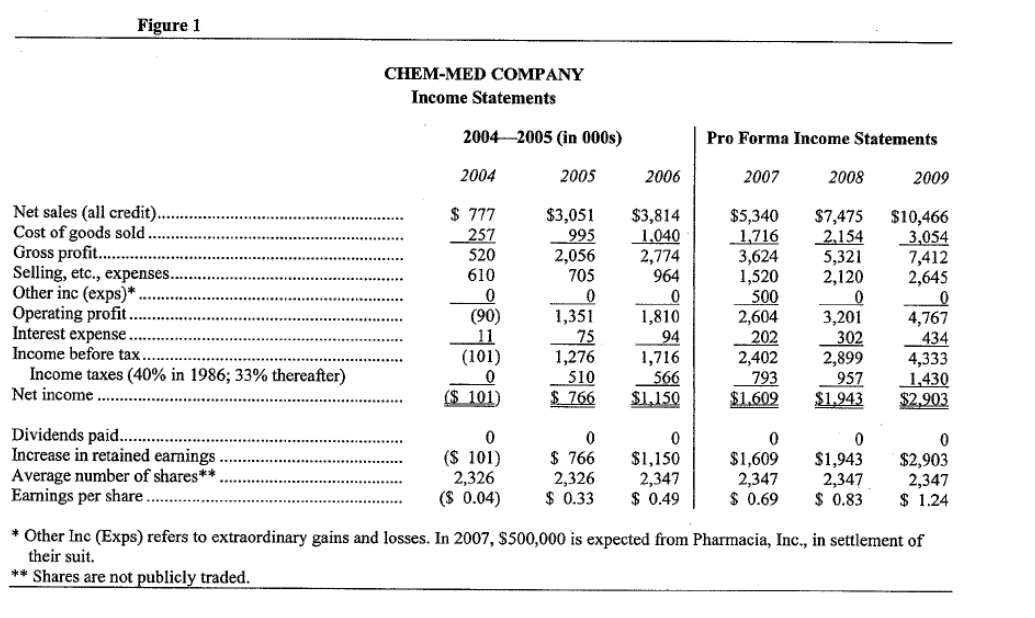
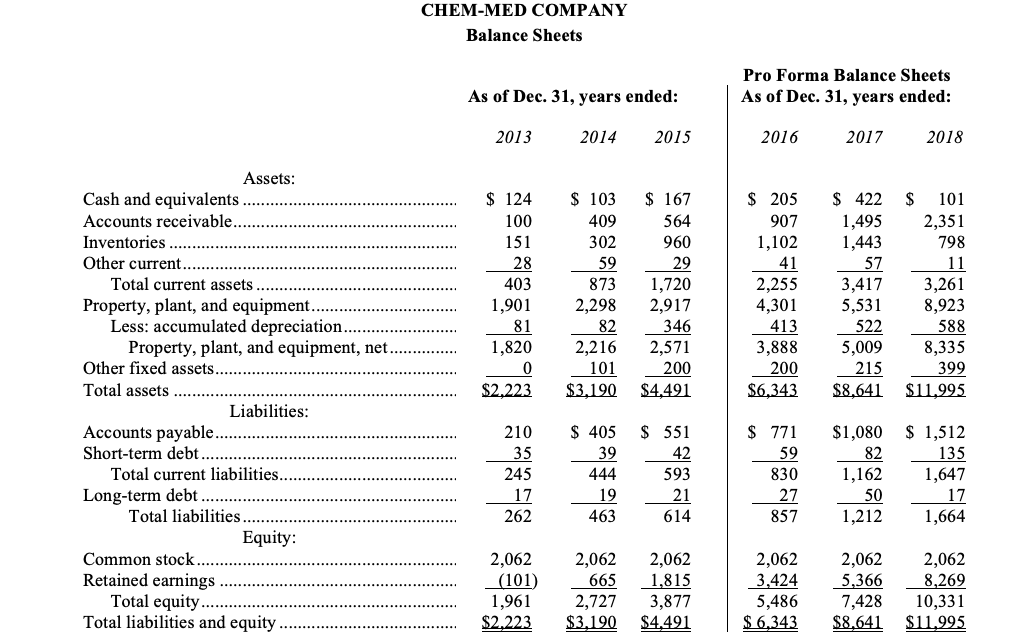
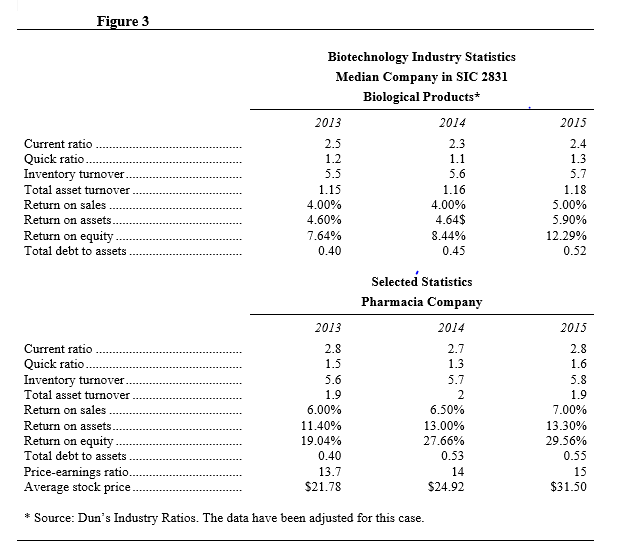
Figure 1 CHEM-MED COMPANY Income Statements 2004-2005 (in 000s) Pro Forma Income Statements 2004 2005 2006 2007 2008 2009 $5,340 1,716 3,624 1,520 Net sales (all credit)... Cost of goods sold Gross profit.... Selling, etc., expenses. Other inc (exps)* Operating profit. Interest expense Income before tax. Income taxes (40% in 1986; 33% thereafter) Net income $ 777 _257 520 610 0 (90) 11 (101) 0 ($ 101 $3,051 995 2,056 705 0 1,351 75 1,276 510 $_766 $3,814 1,040 2,774 964 0 1,810 94 1,716 566 $1,150 500 $7,475 2.154 5,321 2,120 0 3,201 302 2,899 957 $1.943 $10,466 3,054 7,412 2,645 0 4,767 434 4,333 1,430 2,604 202 2,402 793 $1,602 $2,903 Dividends paid........ Increase in retained earnings. Average number of shares** Earnings per share. 0 ($ 101) 2,326 ($ 0.04) 0 $ 766 2,326 $ 0.33 0 $1,150 2,347 $ 0.49 0 $1,609 2,347 $ 0.69 0 $1,943 2,347 $ 0.83 0 $2,903 2,347 $ 1.24 * Other Inc (Exps) refers to extraordinary gains and losses. In 2007, $500,000 is expected from Pharmacia, Inc., in settlement of their suit. ** Shares are not publicly traded. CHEM-MED COMPANY Balance Sheets As of Dec. 31, years ended: Pro Forma Balance Sheets As of Dec. 31, years ended: 2013 2014 2015 2016 2017 2018 $ 124 100 151 28 403 1,901 81 1,820 0 $2,223 $ 103 409 302 59 873 2,298 82 2,216 101 $3,190 $ 167 564 960 29 1,720 2,917 346 2,571 200 $4,491 $ 205 907 1,102 41 2,255 4,301 413 3,888 200 $6,343 $ 422 1,495 1,443 57 3,417 5,531 522 5,009 215 $8,641 $ 101 2,351 798 11 3,261 8,923 588 8,335 399 $11.995 Assets: Cash and equivalents Accounts receivable.. Inventories ...... Other current Total current assets Property, plant, and equipment...... Less: accumulated depreciation.. Property, plant, and equipment, net. Other fixed assets. Total assets Liabilities: Accounts payable. Short-term debt. Total current liabilities.. Long-term debt Total liabilities Equity: Common stock Retained earnings Total equity. Total liabilities and equity 210 35 245 17 262 $ 405 39 444 19 $ 551 42 593 21 614 $ 771 59 830 27 $1,080 82 1,162 50 1,212 $ 1,512 135 1,647 17 1,664 463 857 2,062 2,062 (101) 1,961 $2.223 665 2,727 2,062 1,815 3,877 $4,491 2,062 3,424 5,486 $ 6,343 2,062 5,366 7,428 $8.641 2,062 8,269 10,331 $11.995 $3,190 Figure 3 Current ratio Quick ratio Inventory turnover. Total asset turnover Return on sales Return on assets Return on equity Total debt to assets Biotechnology Industry Statistics Median Company in SIC 2831 Biological Products 2013 2014 2.5 2.3 1.2 1.1 5.5 5.6 1.15 1.16 4.00% 4.00% 4.60% 4.64$ 7.64% 8.44% 0.40 0.45 2015 2.4 1.3 5.7 1.18 5.00% 5.90% 12.29% 0.52 Selected Statistics Pharmacia Company 2014 2015 Current ratio Quick ratio. Inventory turnover Total asset turnover Return on sales Return on assets Return on equity. Total debt to assets Price-earnings ratio. Average stock price. 2013 2.8 1.5 5.6 1.9 6.00% 11.40% 19.04% 0.40 13.7 $21.78 2.7 1.3 5.7 2 6.50% 13.00% 27.66% 0.53 14 $24.92 2.8 1.6 5.8 1.9 7.00% 13.30% 29.56% 0.55 15 $31.50 * Source: Dun's Industry Ratios. The data have been adjusted for this caseStep by Step Solution
There are 3 Steps involved in it
Step: 1

Get Instant Access to Expert-Tailored Solutions
See step-by-step solutions with expert insights and AI powered tools for academic success
Step: 2

Step: 3
Ace Your Homework with AI
Get the answers you need in no time with our AI-driven, step-by-step assistance
Get Started
Uniform Administrative Requirements Cost Principles And Audit Requirements For Federal Awards A Handbook For Institutions Of Higher Education And State And Local Governments
Authors: Andrew Shepard-Smith
1st Edition
1505298482, 978-1505298482