

Answered step by step
Verified Expert Solution
Question
1 Approved Answer
**Please show work via Excel preferably** The table below shows the closing monthly stock prices for IBM and Amazon. Calculate the exponential three-month moving average
**Please show work via Excel preferably**
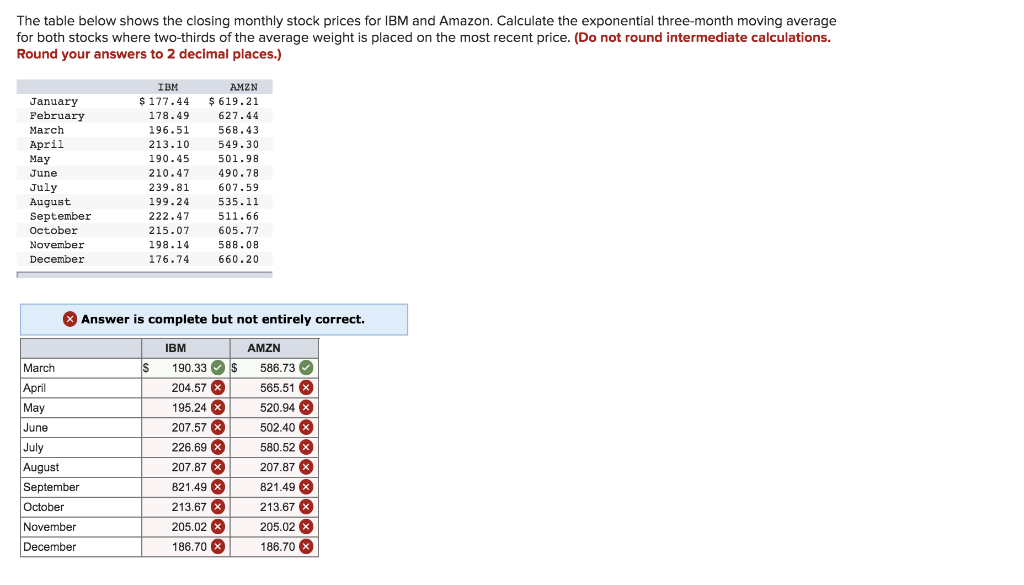
The table below shows the closing monthly stock prices for IBM and Amazon. Calculate the exponential three-month moving average for both stocks where two-thirds of the average weight is placed on the most recent price. (Do not round intermediate calculations. Round your answers to 2 decimal places.) January Pebruary March April May June July August September October November December IBM $ 177.44 178.49 196.51 213.10 190.45 210.47 239.81 199.24 222.47 215.07 198.14 176.74 AMZN $ 619.21 627.44 568.43 549.30 501.98 490.78 607.59 535.11 511.66 605.77 588.08 660.20 Answer is complete but not entirely correct. March S IBM 190.33 $ 204.57 X 195.24 X 207.57 X AMZN 586.73 565.51 x 520.94 X 502.40 X 580.52 X 207.87 X 821.49 X 213.67 X April May June July August September October November 226.69 X 207.87 X 821.49 X 213.67 X 205.02 X 205.02 X December 186.70 X 186.70 XStep by Step Solution
There are 3 Steps involved in it
Step: 1

Get Instant Access to Expert-Tailored Solutions
See step-by-step solutions with expert insights and AI powered tools for academic success
Step: 2

Step: 3
Ace Your Homework with AI
Get the answers you need in no time with our AI-driven, step-by-step assistance
Get Started
Forex Analysis And Strategies For Day Traders Profitable Investing With Currency Swaps Hedges And Scalps For Both Beginning And Advanced Traders
Authors: Steve Alkandros
1st Edition
1545117039, 978-1545117033