please show your work. step by step
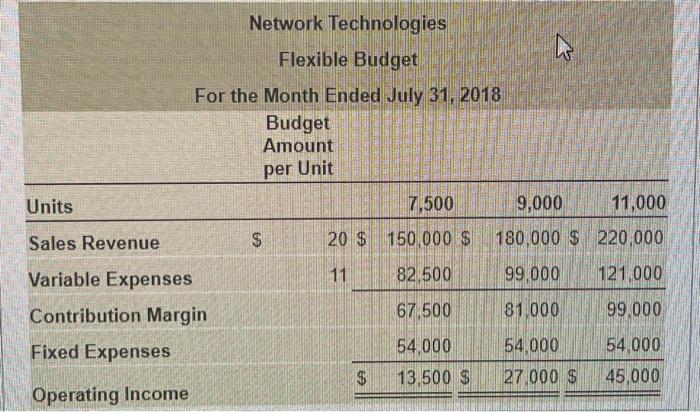
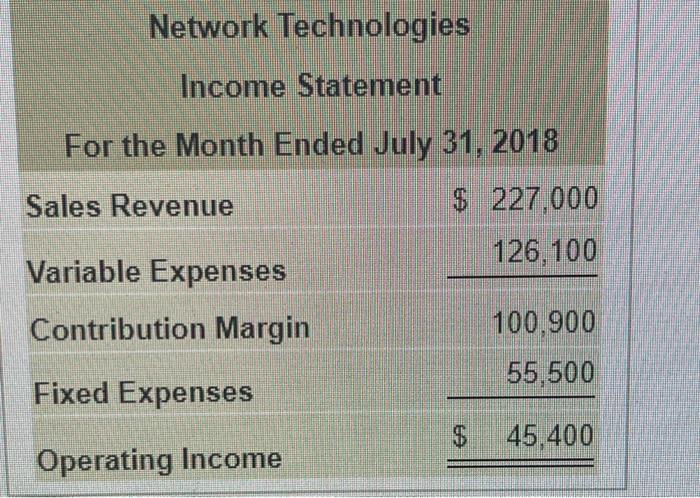
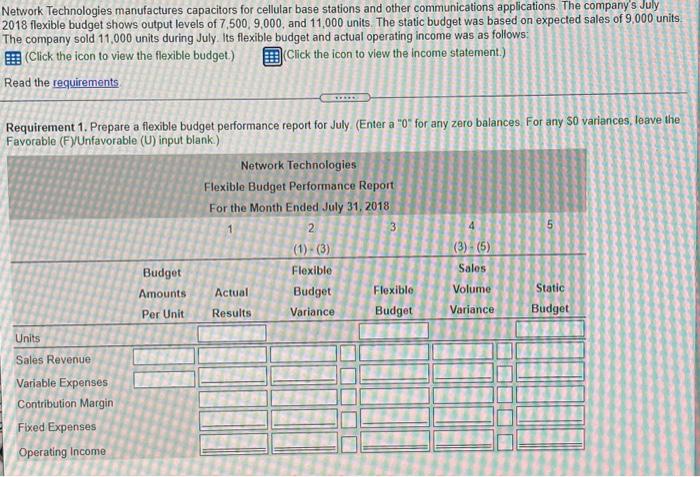
Network Technologies Flexible Budget For the Month Ended July 31, 2018 Budget Amount per Unit Units 7,500 9,000 11,000 180,000 $ 220,000 Sales Revenue $ 20 $ 150,000 $ Variable Expenses 11 82,500 99.000 121,000 Contribution Margin 67 500 81,000 99,000 Fixed Expenses 54,000 54,000 54.000 $ 13,500 $ 27 000 $ 45,000 Operating Income Network Technologies Income Statement For the Month Ended July 31, 2018 Sales Revenue $ 227,000 Variable Expenses 126,100 Contribution Margin 100.900 55,500 Fixed Expenses $ 45,400 Operating Income 1. Prepare a flexible budget performance report for July 2. What was the effect on Network's operating income of selling 2,000 units more than the static budget level of sales? 3. What is Network's static budget variance for operating income? 4. Explain why the flexible budget performance report provides more useful information to Network's managers than the simple static budget variance. What insights can Network's managers draw from this performance report? Network Technologies manufactures capacitors for cellular base stations and other communications applications The company's July 2018 flexible budget shows output levels of 7,500, 9,000 and 11,000 units. The static budget was based on expected sales of 9,000 units The company sold 11,000 units during July. Its flexible budget and actual operating income was as follows: E. (Click the icon to view the flexible budget) Click the icon to view the income statement.) Read the requirements Requirement 1. Prepare a flexible budget performance report for July (Enter a "O" for any zero balances. For any 50 variances, leave the Favorable (FY/Unfavorable (U) input blank.) Network Technologies Flexible Budget Performance Report For the Month Ended July 31, 2018 2 3 5 (1)-(3) (3) (5) Budget Flexible Sales Amounts Actual Budget Flexible Static Volume Per Unit Results Variance Budget Variance Budget Units Sales Revenue JU Variable Expenses Contribution Margin Fixed Expenses Operating Income