Answered step by step
Verified Expert Solution
Link Copied!

Question

1 Approved Answer

Please show your work. You work for an agricultural extension office in an area of a developing country where medium- sized farms grow soybeans and

Please show your work.
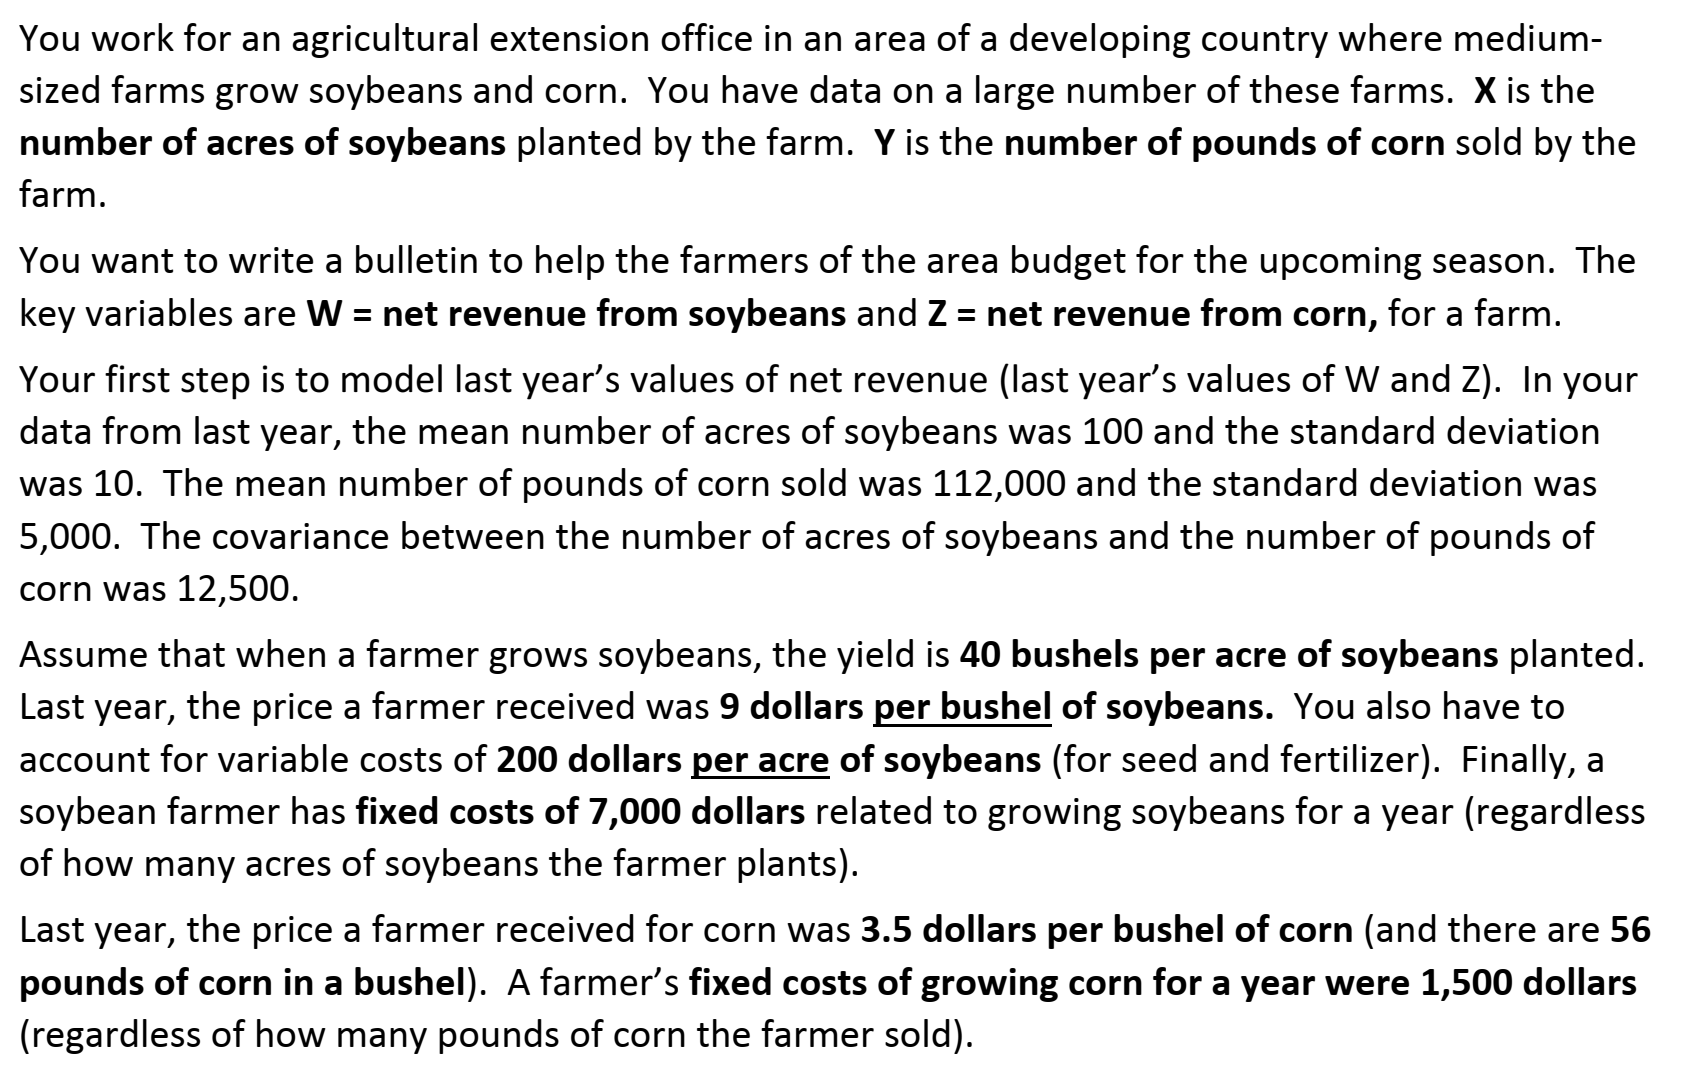
image text in transcribedimage text in transcribed
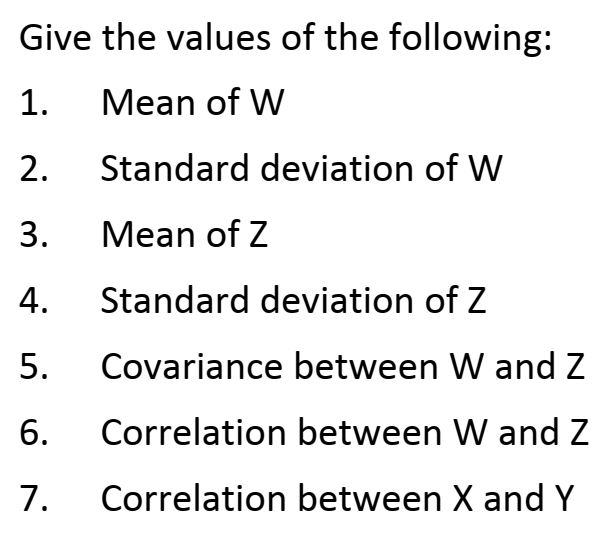
You work for an agricultural extension office in an area of a developing country where medium- sized farms grow soybeans and corn. You have data on a large number of these farms. Xis the number of acres of soybeans planted by the farm. Y is the number of pounds of corn sold by the farm. You want to write a bulletin to help the farmers of the area budget for the upcoming season. The key variables are W = net revenue from soybeans and Z = net revenue from corn, for a farm. Your first step is to model last year's values of net revenue (last year's values of W and Z). In your data from last year, the mean number of acres of soybeans was 100 and the standard deviation was 10. The mean number of pounds of corn sold was 112,000 and the standard deviation was 5,000. The covariance between the number of acres of soybeans and the number of pounds of corn was 12,500. Assume that when a farmer grows soybeans, the yield is 40 bushels per acre of soybeans planted. Last year, the price a farmer received was 9 dollars per bushel of soybeans. You also have to account for variable costs of 200 dollars per acre of soybeans (for seed and fertilizer). Finally, a soybean farmer has fixed costs of 7,000 dollars related to growing soybeans for a year (regardless of how many acres of soybeans the farmer plants). Last year, the price a farmer received for corn was 3.5 dollars per bushel of corn (and there are 56 pounds of corn in a bushel). A farmer's fixed costs of growing corn for a year were 1,500 dollars (regardless of how many pounds of corn the farmer sold). Give the values of the following: Mean of W Standard deviation of W Mean of Z Standard deviation of Z Covariance between W and Z Correlation between W and Z NO@ A s W N Correlation between X and Y

Step by Step Solution

There are 3 Steps involved in it

Step: 1

blur-text-image

Get Instant Access to Expert-Tailored Solutions

See step-by-step solutions with expert insights and AI powered tools for academic success

Step: 2

blur-text-image

Step: 3

blur-text-image

Ace Your Homework with AI

Get the answers you need in no time with our AI-driven, step-by-step assistance

Get Started

Recommended Textbook for

Making Hard Decisions with decision tools

Authors: Robert Clemen, Terence Reilly

3rd edition

538797576, 978-0538797573

More Books

Students also viewed these Mathematics questions

Question

(b) NNP and NDP

Answered: 1 week ago