Please solve
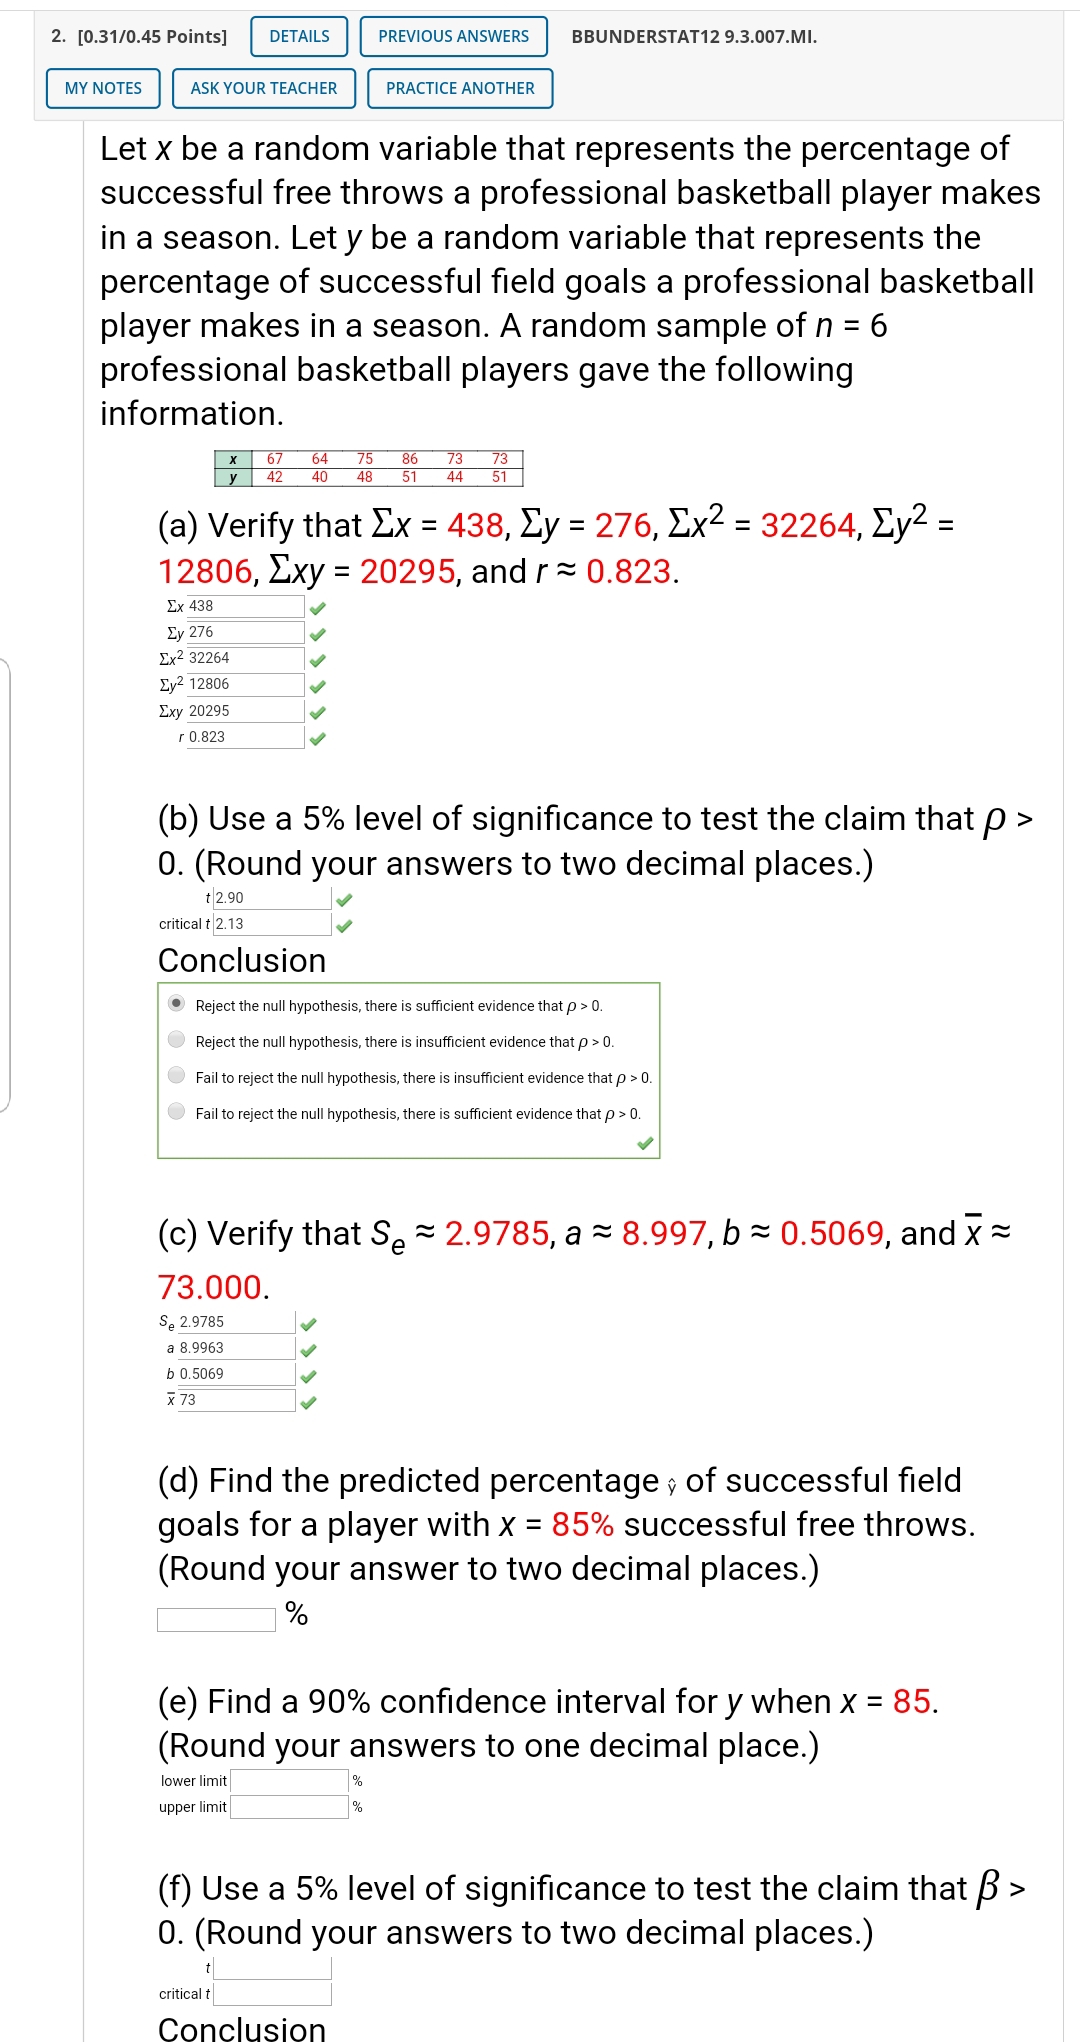
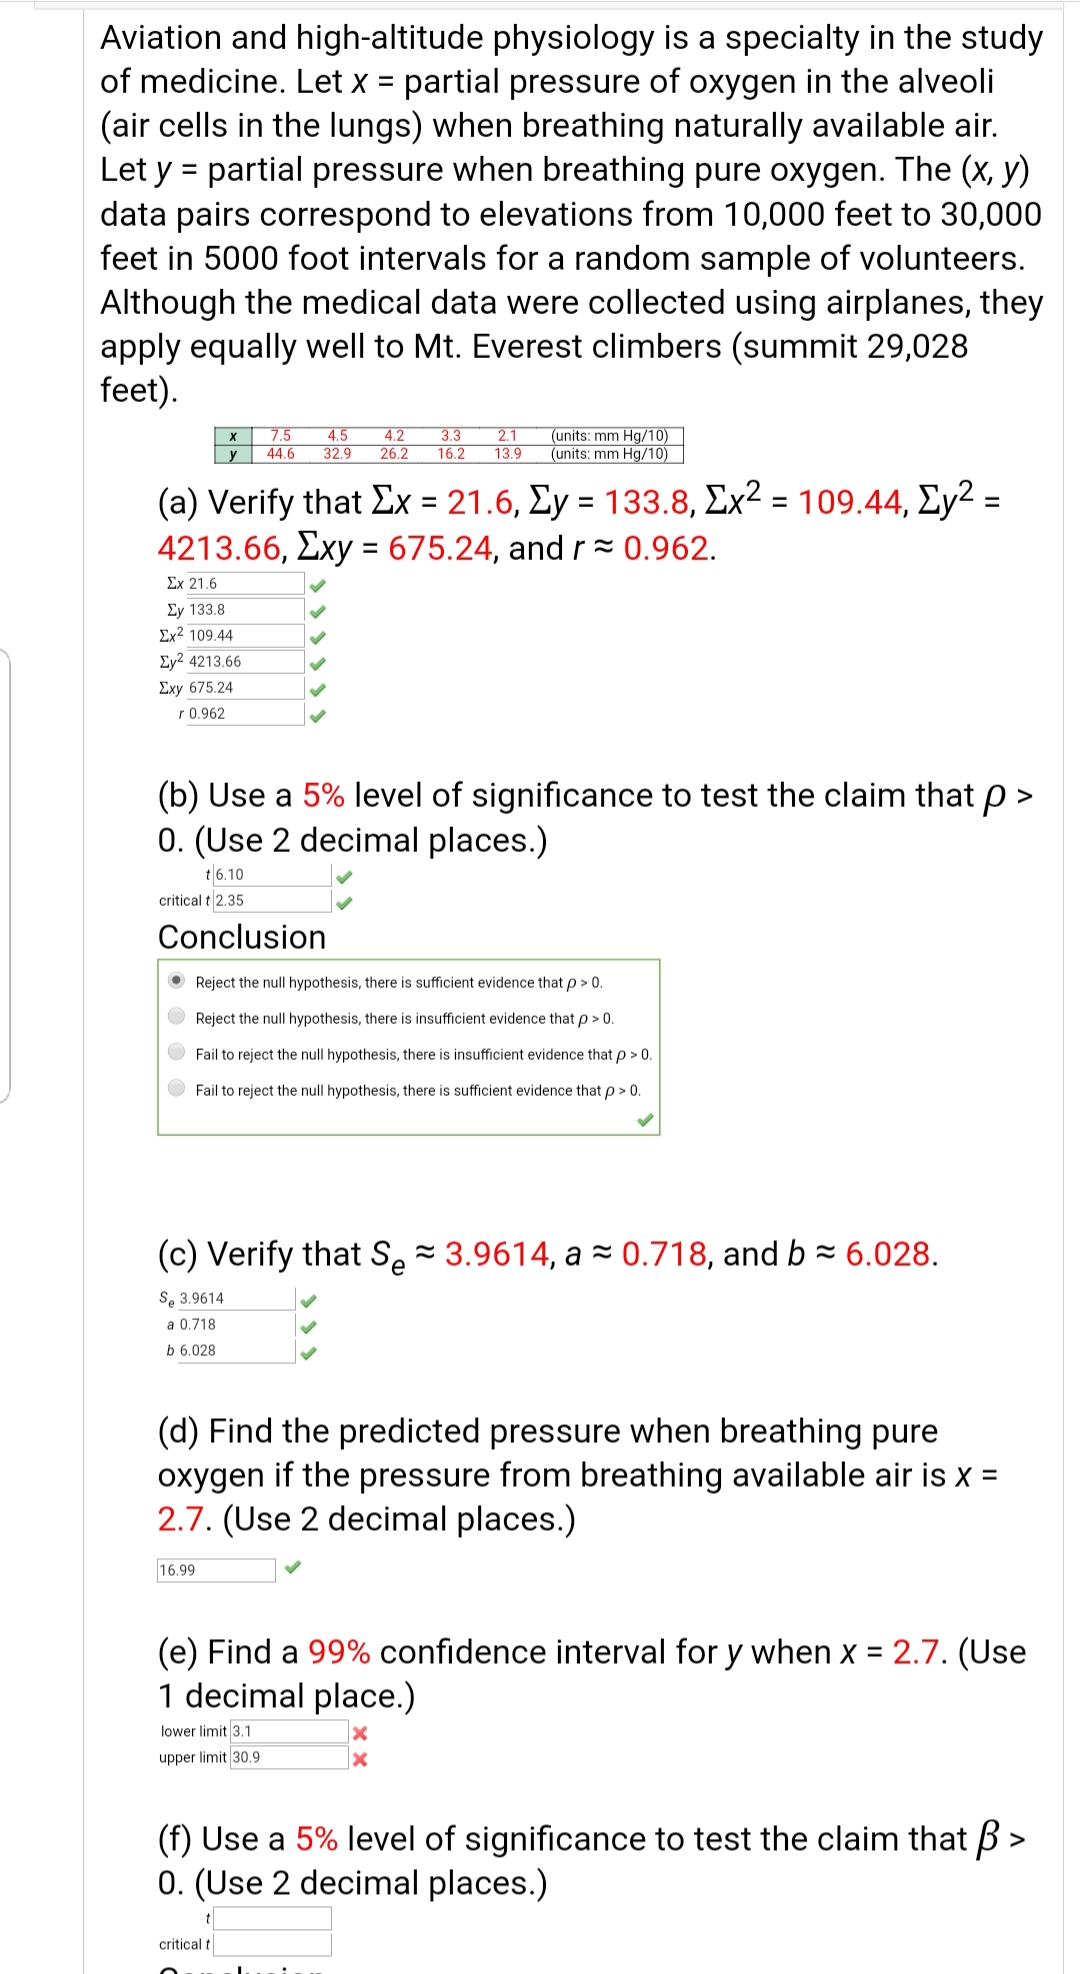
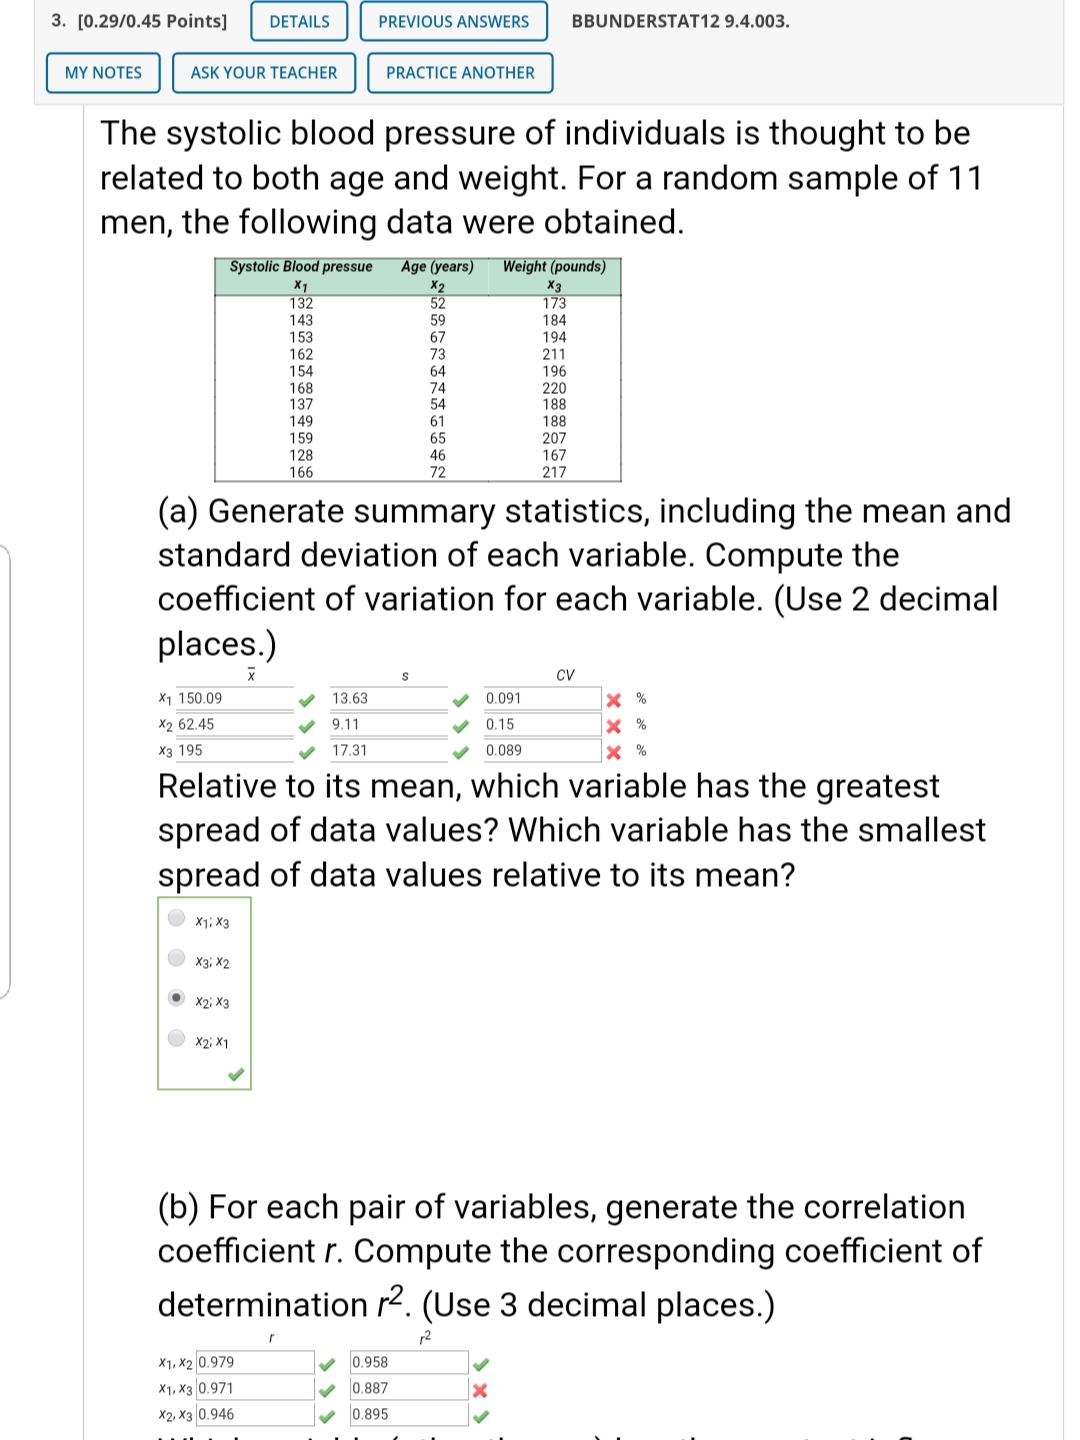
2. [0.31/0.45 Points] DETAILS PREVIOUS ANSWERS BBUNDERSTAT12 9.3.007.MI. MY NOTES ASK YOUR TEACHER PRACTICE ANOTHER Let x be a random variable that represents the percentage of successful free throws a professional basketball player makes in a season. Let y be a random variable that represents the percentage of successful field goals a professional basketball player makes in a season. A random sample of n = 6 professional basketball players gave the following information. 42 40 48 86 44 (a) Verify that Ex = 438, Zy = 276, Ex2 = 32264, Ey2 = 12806, Exy = 20295, and r = 0.823. Ex 438 Ey 276 Ex2 32264 Ey2 1280 Exy 20295 r 0.823 (b) Use a 5% level of significance to test the claim that p > 0. (Round your answers to two decimal places.) t 2.90 critical t 2.13 Conclusion . Reject the null hypothesis, there is sufficient evidence that p > 0. Reject the null hypothesis, there is insufficient evidence that p > 0. Fail to reject the null hypothesis, there is insufficient evidence that p > 0. Fail to reject the null hypothesis, there is sufficient evidence that p > 0. (c) Verify that Se ~ 2.9785, a ~ 8.997, b = 0.5069, and x = 73.000. Se 2.9785 a 8.9963 b 0.5069 x 73 (d) Find the predicted percentage , of successful field goals for a player with x = 85% successful free throws. (Round your answer to two decimal places.) (e) Find a 90% confidence interval for y when x = 85. (Round your answers to one decimal place.) lower limit upper limit (f) Use a 5% level of significance to test the claim that B> 0. (Round your answers to two decimal places.) critical t ConclusionAviation and high-altitude physiology is a specialty in the study of medicine. Let x = partial pressure of oxygen in the alveoli (air cells in the lungs) when breathing naturally available air. Let y = partial pressure when breathing pure oxygen. The (X, y) data pairs correspond to elevations from 10,000 feet to 30,000 feet in 5000 foot intervals for a random sample of volunteers. Although the medical data were collected using airplanes, they apply equally well to Mt. Everest climbers (summit 29,028 feet). (a) Verify that Ex = 21.6,)3y = 133.8, 2x2 = 109.44, >3y2 = 4213.66,ny = 675.24, and r = 0.962. Ex 21.6 2y 133.8 21:2 109.44 11172 4213.66 Exy 675.24 r 0.962 S$ (b) Use a 5% level of signicance to test the claim that p > 0. (Use 2 decimal places.) t6.10 v critical t|2.35 1,; Conclusion 0 Reject the null hypothesis, there is sufcient evidence that p a 0. - Reject the null hypothesis. there is insufficient evidence that p > 0. Fail to reject the null hypothesis, there is insufcient evidence that p > U. - Fail to reject the null hypothesis, there is sufficient evidence that p > O. I (c) Verify that Se = 3.9614, a = 0.718, and b = 6.028. sE 3.9614 |., a 0.718 | b 6.028 | (d) Find the predicted pressure when breathing pure oxygen if the pressure from breathing available air is x = 2.7. (Use 2 decimal places.) |16.99 l I (e) Find a 99% confidence interval for y when x = 2.7. (Use 1 decimal place.) |owerlimit|3.1 lx upper limit |30.9 M (f) Use a 5% level of signicance to test the claim that [3 > 0. (Use 2 decimal places.) T| l critical tl l ,,,,l,,,!,,, 3. [02910.45 Points] DETAILS PREVIOUS ANSWERS BBUNDERSTAT12 9.4.003. MY NOTES ASK YOUR TEACHER PRACTICE ANOTHER The systolic blood pressure of individuals is thought to be related to both age and weight. For a random sample of 11 men, the following data were obtained. (a) Generate summary statistics, including the mean and standard deviation of each variable. Compute the coefficient of variation for each variable. (Use 2 decimal places.) E 5 CV 111150.09 13.53 0.091 |x 1. 1262.45 q 9.11 .p 0.15 |x 91 113195 17.31 'I 0.039 |x 1. Relative to its mean, which variable has the greatest spread of data values? Which variable has the smallest spread of data values relative to its mean? (b) For each pair of variables, generate the correlation coefficient r. Compute the corresponding coefficient of determination r2. (Use 3 decimal places.) r2 r x1.leo.9}'9 | |o.953 | x1.xa|0.9Tl | |o.aa:r |g x2.x3|0.946 | |o.a95 |