


Please solve above question as much as you can.
Balance sheet and Income statements are given below.
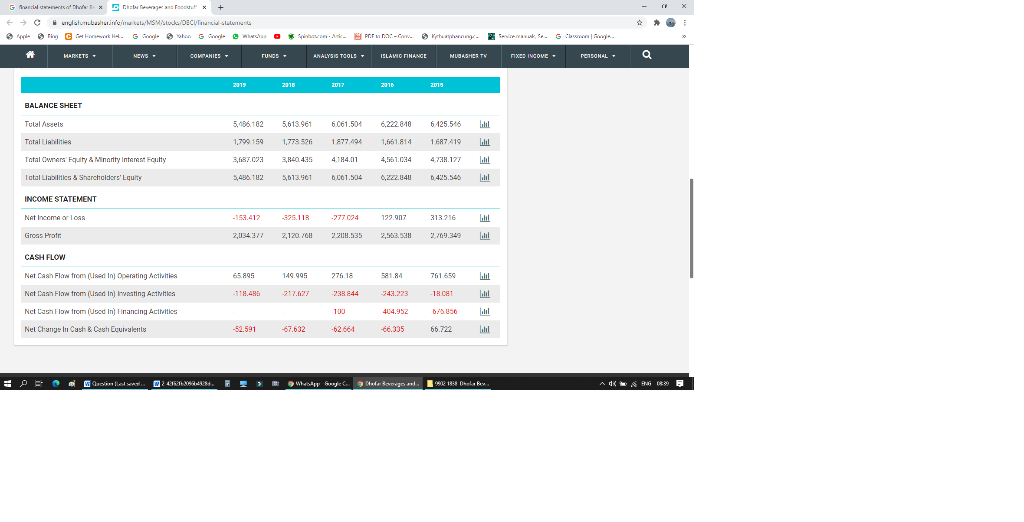
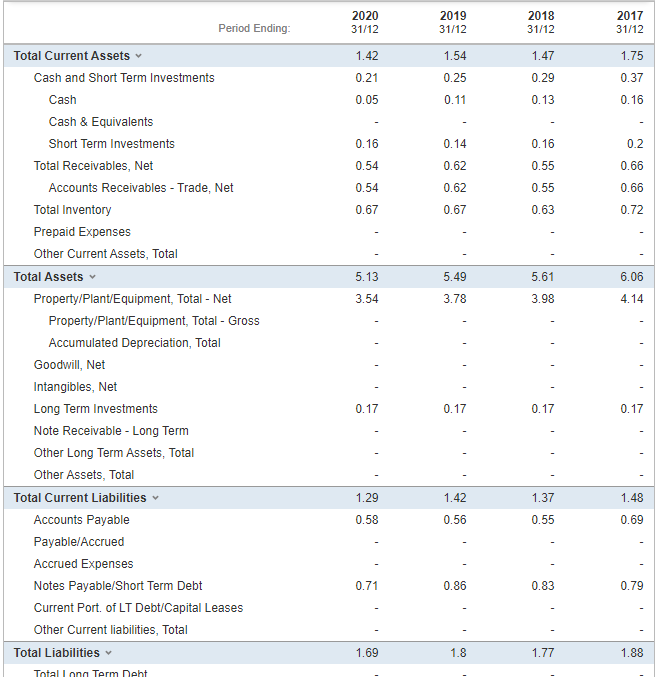
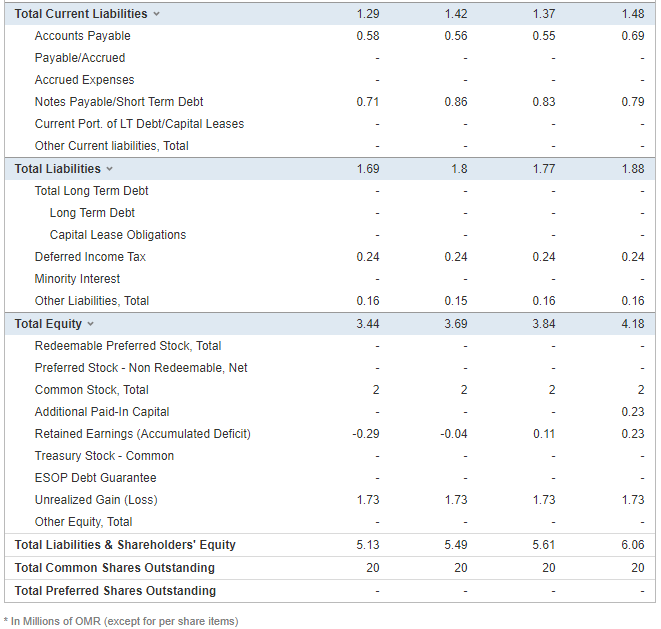
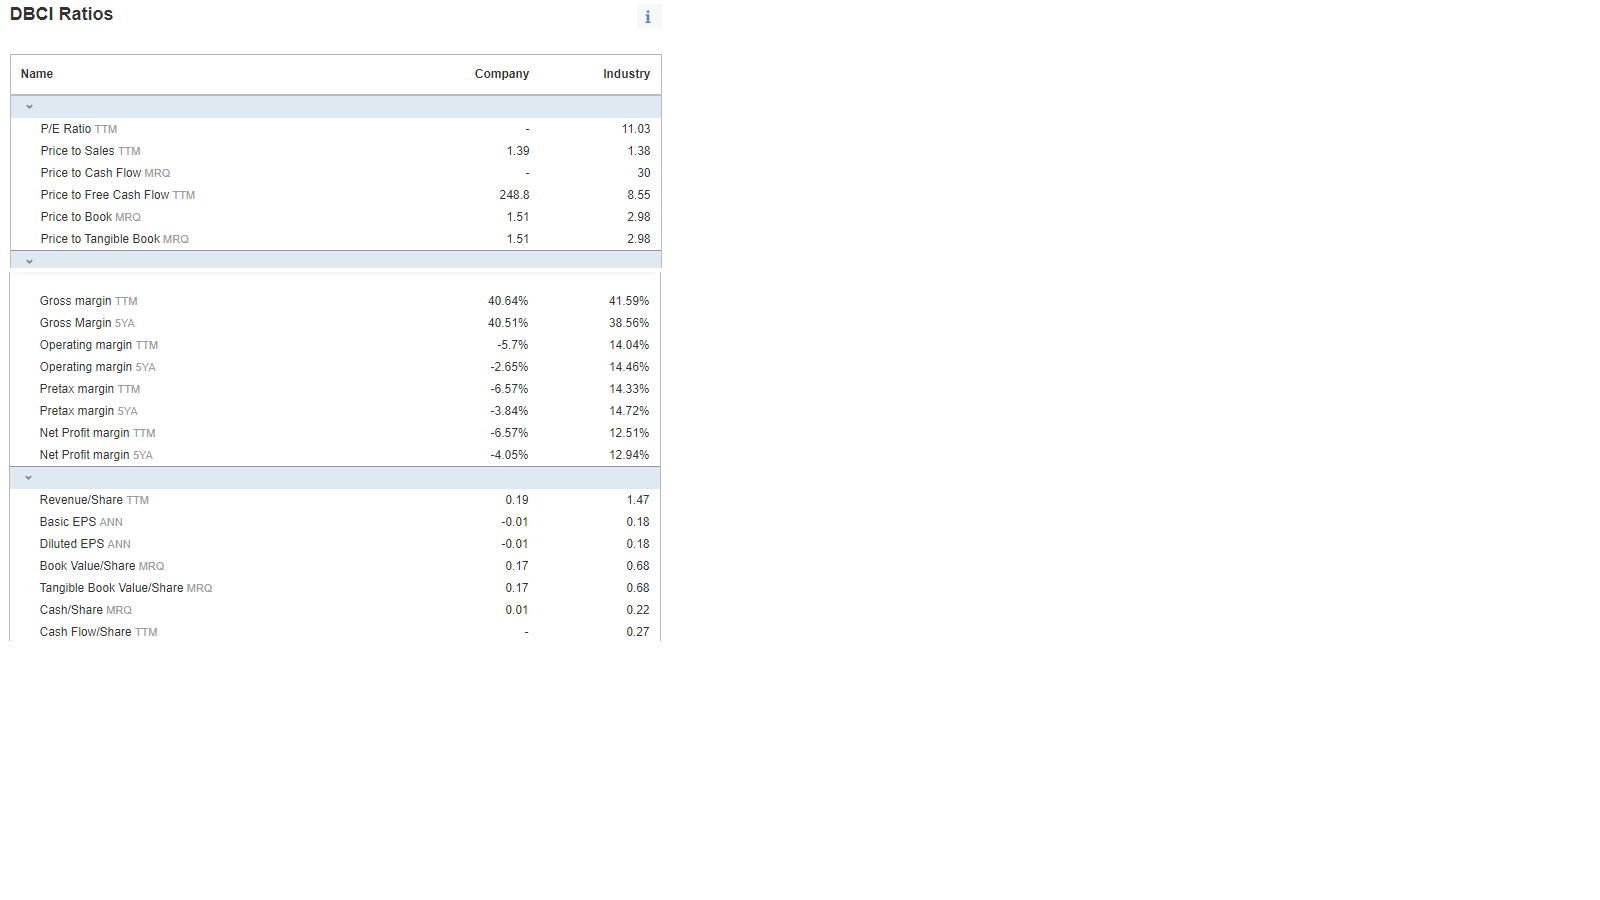
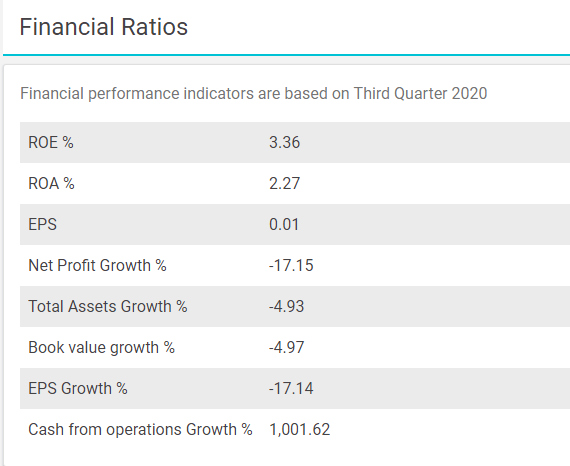

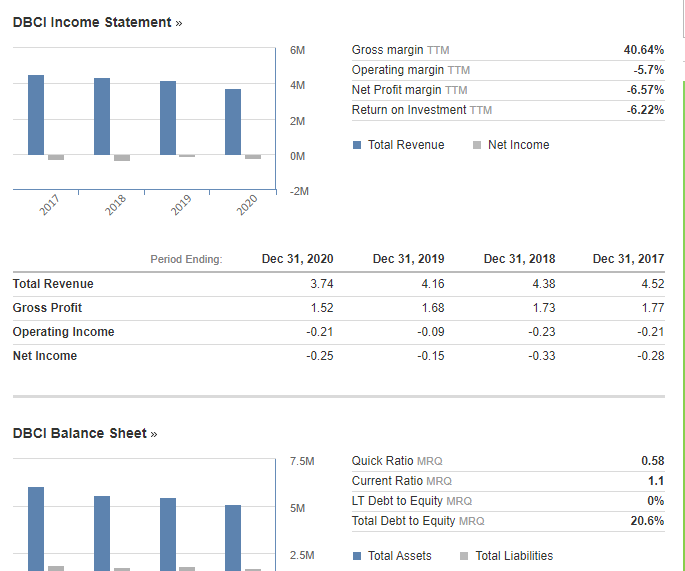
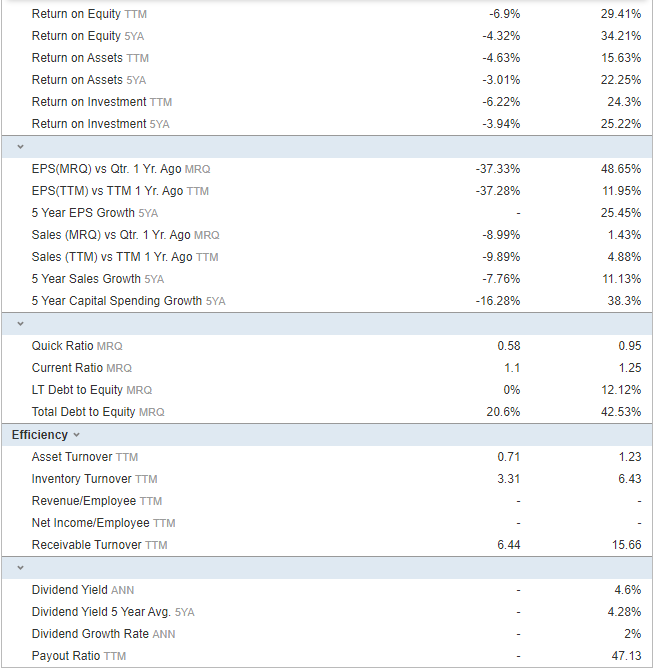
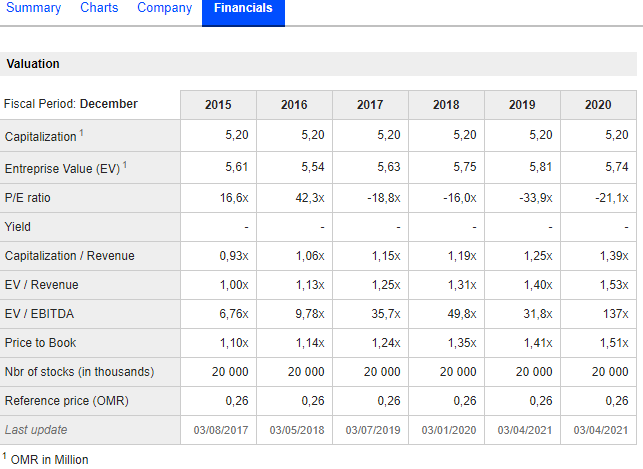
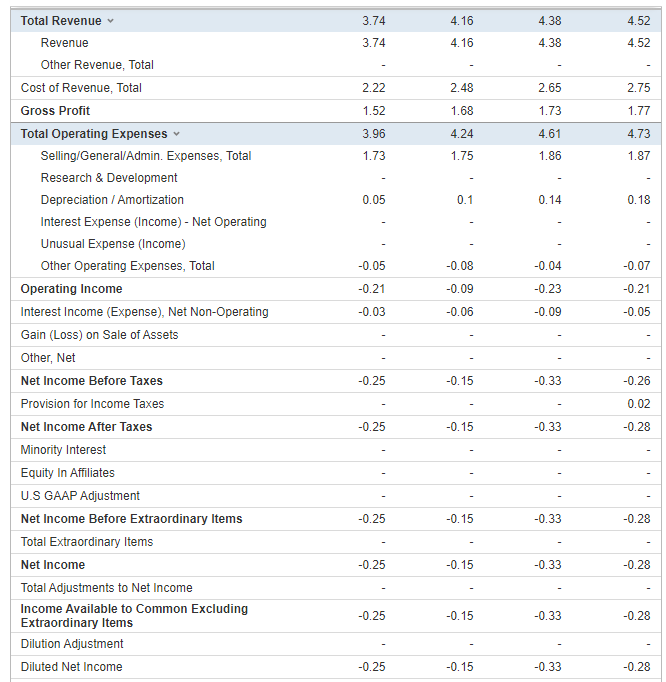
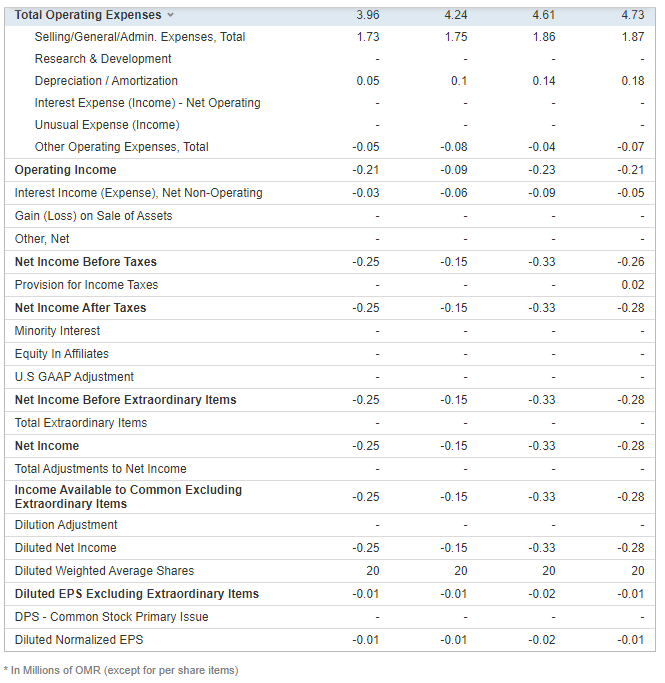
8. Risk Analysis: a. Quick Ratio (Acid Test Ratio). b. Working capital Activity ratio. 9. Long-Term Solvency Risk-Debt Ratios: a. L.T. Debt Ratio. b. Debt/Equity Ratio. c. L.T. Debt/Asset Ratio. 10. Multiple Discriminant Analysis: a. Altman's Z-Score. G H x Bags Foot' x + na watumbasim bel/MISWA/DECUTIKSLAS C. Gw We G Wherche .. Gavek se G C MARKETS NEWS. COMPANIES FUNDS. ANALYSIS TOOLS - ISLAVIO FINANCE NLEASHES TU XED INCOVE. PERSONAL O 2019 2015 2017 205 BALANCE SHEET Tulal Assels 5,106,182 5,613.961 6.061.504 6.222.840 6:125.546 Total 1,799.159 1,779 526 1877.404 1,661.814 1 687 419 3,840.435 4.184.01 4.738.177 Total Owners' Equity & Minority interest Faulty Total Liabilities & Sharcholders' Equity 5,455102 5,613.561 0.001.504 425.54 INCOME STATEMENT Not Income or los -158.412 -325.118 -277024 173.007 313916 Gross Pratr 2,120.7011 2208.535 2,563.3 CASH FLOW NAT Cash Flow from(used in Oberating Activiti 65995 149.995 276 18 581.84 761 656 LA - 118.45 238 844 243.223 1801 lil Net Dash Flow from (Used In Investing Activities Net Cashion from (Used In) Financing Activities Nel Change In Cash & Cast Equivalents 100 404.952 5/5.250 52.591 -67.632 -62664 -66.335 66.722 W > Way Sweden. 1838 Dela Bex 2020 31/12 2019 31/12 2018 31/12 2017 31/12 1.42 1.54 1.75 1.47 0.29 0.21 0.25 0.37 0.05 0.11 0.13 0.16 0.14 0.2 0.16 0.54 0.16 0.55 0.55 0.62 0.62 0.66 0.54 0.66 0.67 0.67 0.63 0.72 5.49 6.06 5.13 3.54 5.61 3.98 3.78 4.14 Period Ending: Total Current Assets Cash and Short Term Investments Cash Cash & Equivalents Short Term Investments Total Receivables, Net Accounts Receivables - Trade, Net Total Inventory Prepaid Expenses Other Current Assets, Total Total Assets Property/Plant/Equipment, Total - Net Property/Plant/Equipment, Total - Gross Accumulated Depreciation, Total Goodwill, Net Intangibles, Net Long Term Investments Note Receivable - Long Term Other Long Term Assets, Total Other Assets, Total Total Current Liabilities Accounts Payable Payable/Accrued Accrued Expenses Notes Payable/Short Term Debt Current Port of LT Debt/Capital Leases Other Current liabilities, Total Total Liabilities 0.17 0.17 0.17 0.17 1.29 1.42 1.37 1.48 0.58 0.56 0.55 0.69 0.71 0.86 0.83 0.79 1.69 1.8 1.77 1.88 Total Long Term Deht 1.29 1.42 1.37 1.48 0.58 0.56 0.55 0.69 0.71 0.86 0.83 0.79 1.69 1.8 1.77 1.88 0.24 0.24 0.24 0.24 Total Current Liabilities Accounts Payable Payable/Accrued Accrued Expenses Notes Payable/Short Term Debt Current Port of LT Debt/Capital Leases Other Current liabilities, Total Total Liabilities Total Long Term Debt Long Term Debt Capital Lease Obligations Deferred Income Tax Minority Interest Other Liabilities, Total Total Equity Redeemable Preferred Stock, Total Preferred Stock - Non Redeemable, Net Common Stock, Total Additional Paid-In Capital Retained Earnings (Accumulated Deficit) Treasury Stock - Common ESOP Debt Guarantee Unrealized Gain (Loss) Other Equity, Total Total Liabilities & Shareholders' Equity Total Common Shares Outstanding Total Preferred Shares Outstanding 0.16 0.15 0.16 0.16 3.44 3.69 3.84 4.18 2 2 2 2 0.23 -0.29 -0.04 0.11 0.23 1.73 1.73 1.73 1.73 5.13 5.49 5.61 6.06 20 20 20 20 * In Millions of OMR (except for per share items) DBCI Ratios i Name Company Industry 11.03 1.39 1.38 - 30 P/E Ratio TTM Price to Sales TTM Price to Cash Flow MRQ Price to Free Cash Flow TTM Price to Book MRQ Price to Tangible Book MRQ 248.8 1.51 8.55 2.98 2.98 1.51 40.64% 41.59% 38.56% 40.51% 14.04% -5.7% -2.65% 14.46% Gross margin TTM Gross Margin 5YA Operating margin TTM Operating margin 5YA Pretax margin TTM Pretax margin SYA Net Profit margin TTM Net Profit margin SYA -6.57% 14.33% -3.84% 14.72% -6.57% 12.51% -4.05% 12.94% 0.19 1.47 -0.01 0.18 Revenue/Share TTM Basic EPS ANN Diluted EPS ANN Book Value/Share MRQ Tangible Book Value/Share MRQ -0.01 0.17 0.18 0.68 0.17 0.68 Cash/Share MRQ 0.01 0.22 Cash Flow/Share TTM 0.27 Financial Ratios Financial performance indicators are based on Third Quarter 2020 ROE % 3.36 ROA % 2.27 EPS 0.01 Net Profit Growth % -17.15 Total Assets Growth % -4.93 Book value growth % -4.97 EPS Growth % -17.14 Cash from operations Growth % 1,001.62 ANNOUNCEMENT DATE EFFECTIVE FROM TYPE DESCRIPTION 07 March 2017 02 April 2017 Cash Dividends OGM on 2017-04-13 decided OMR 0.005 dividend payout 18 February 2016 20 March 2016 Cash Dividends OGM on 2016-04-01 decided OMR 0.015 dividend payout 26 February 2015 18 March 2015 Cash Dividends OGM on 2015-04-02 decided OMR 0.01 dividend payout 24 March 2014 24 March 2014 Cash Dividends OGM on 2014-03-24 decided OMR 0.009 dividend payout 04 March 2013 25 March 2013 Cash Dividends OGM on 2013-03-25 decided OMR 0.005 dividend payout for Previous FY DBCI Income Statement >> 6M 40.64% -5.7% 4M Gross margin TTM Operating margin TTM Net Profit margin TTM Return on Investment TTM -6.57% -6.22% 11 1 2M Total Revenue Net Income OM - 2M 2017 2018 2019 2020 Period Ending: Dec 31, 2020 Dec 31, 2018 Dec 31, 2017 3.74 Dec 31, 2019 4.16 1.68 4.38 4.52 1.52 1.73 1.77 Total Revenue Gross Profit Operating Income Net Income -0.21 -0.09 -0.23 -0.21 -0.25 -0.15 -0.33 -0.28 DBCI Balance Sheet >> 7.5M Quick Ratio MRQ Current Ratio MRQ LT Debt to Equity MRQ Total Debt to Equity MRQ 0.58 1.1 0% 20.6% 5M 2.5M Total Assets Total Liabilities -6.9% -4.32% 29.41% 34.21% 15.63% Return on Equity TTM Return on Equity 5YA Return on Assets ITM Return on Assets SYA Return on Investment TTM Return on Investment 5YA -4.63% -3.01% 22.25% -6.22% 24.3% -3.94% 25.22% -37.33% 48.65% -37.28% 11.95% 25.45% EPS(MRO) vs Qtr. 1 Yr. Ago MRQ EPS(TTM) vs TTM 1 Yr. Ago TTM 5 Year EPS Growth SYA Sales (MRO) vs Qtr. 1 Yr. Ago MRQ Sales (TTM) vs TTM 1 Yr. Ago TTM 5 Year Sales Growth SYA 5 Year Capital Spending Growth SYA -8.99% 1.43% -9.89% 4.88% -7.76% 11.13% -16.28% 38.3% 0.58 0.95 1.1 1.25 0% 12.12% 20.6% 42.53% Quick Ratio MRQ Current Ratio MRO LT Debt to Equity MRQ Total Debt to Equity MRQ Efficiency Asset Turnover TTM Inventory Turnover TTM Revenue/Employee TTM Net Income/Employee TTM Receivable Turnover TTM 0.71 1.23 3.31 6.43 6.44 15.66 4.6% 4.28% Dividend Yield ANN Dividend Yield 5 Year Avg. SYA Dividend Growth Rate ANN Payout Ratio TTM 2% 47.13 Summary Charts Company Financials Valuation Fiscal Period: December 2015 2016 2017 2018 2019 2020 5,20 5,20 5,20 5,20 5,20 5,20 Capitalization Entreprise Value (EV) P/E ratio 5,61 5,54 5,63 5,75 5,81 5,74 16,6% 42,3x -18,8x - 16,0x -33,9x -21,1x Yield Capitalization / Revenue 0,93x 1,06x 1,15x 1,19x 1,25x 1,39% EV / Revenue 1,00% 1,13x 1,25x 1,31% 1,40X 1,53x 6,76x 9,78% 35,7% 49,8x 31,8% 137x EV / EBITDA Price to Book 1,10x 1,14x 1,24x 1,35x 1,41x 1,51x 20 000 20 000 20 000 20 000 20 000 20 000 Nbr of stocks (in thousands) Reference price (OMR) Last update 0,26 0,26 0,26 0,26 0,26 0,26 03/08/2017 03/05/2018 03/07/2019 03/01/2020 03/04/2021 03/04/2021 1 OMR in Million 3.96 4.24 4.61 4.73 1.73 1.75 1.86 1.87 0.05 0.1 0.14 0.18 -0.05 -0.08 -0.04 -0.07 -0.21 -0.09 -0.23 -0.21 -0.03 -0.06 -0.09 -0.05 -0.25 -0.15 -0.33 -0.26 0.02 -0.25 -0.15 -0.33 -0.28 Total Operating Expenses Selling/General/Admin. Expenses, Total Research & Development Depreciation / Amortization Interest Expense (Income) - Net Operating Unusual Expense (Income) Other Operating Expenses, Total Operating Income Interest Income (Expense), Net Non-Operating Gain (Loss) on Sale of Assets Other, Net Net Income Before Taxes Provision for Income Taxes Net Income After Taxes Minority Interest Equity In Affiliates U.S GAAP Adjustment Net Income Before Extraordinary Items Total Extraordinary Items Net Income Total Adjustments to Net Income Income Available to Common Excluding Extraordinary Items Dilution Adjustment Diluted Net Income Diluted Weighted Average Shares Diluted EPS Excluding Extraordinary Items DPS - Common Stock Primary Issue Diluted Normalized EPS -0.25 -0.15 -0.33 -0.28 -0.25 -0.15 -0.33 -0.28 -0.25 -0.15 -0.33 -0.28 -0.15 -0.33 -0.28 -0.25 20 20 20 20 -0.01 -0.01 -0.02 -0.01 -0.01 -0.01 -0.02 -0.01 * In Millions of OMR (except for per share items) 8. Risk Analysis: a. Quick Ratio (Acid Test Ratio). b. Working capital Activity ratio. 9. Long-Term Solvency Risk-Debt Ratios: a. L.T. Debt Ratio. b. Debt/Equity Ratio. c. L.T. Debt/Asset Ratio. 10. Multiple Discriminant Analysis: a. Altman's Z-Score. G H x Bags Foot' x + na watumbasim bel/MISWA/DECUTIKSLAS C. Gw We G Wherche .. Gavek se G C MARKETS NEWS. COMPANIES FUNDS. ANALYSIS TOOLS - ISLAVIO FINANCE NLEASHES TU XED INCOVE. PERSONAL O 2019 2015 2017 205 BALANCE SHEET Tulal Assels 5,106,182 5,613.961 6.061.504 6.222.840 6:125.546 Total 1,799.159 1,779 526 1877.404 1,661.814 1 687 419 3,840.435 4.184.01 4.738.177 Total Owners' Equity & Minority interest Faulty Total Liabilities & Sharcholders' Equity 5,455102 5,613.561 0.001.504 425.54 INCOME STATEMENT Not Income or los -158.412 -325.118 -277024 173.007 313916 Gross Pratr 2,120.7011 2208.535 2,563.3 CASH FLOW NAT Cash Flow from(used in Oberating Activiti 65995 149.995 276 18 581.84 761 656 LA - 118.45 238 844 243.223 1801 lil Net Dash Flow from (Used In Investing Activities Net Cashion from (Used In) Financing Activities Nel Change In Cash & Cast Equivalents 100 404.952 5/5.250 52.591 -67.632 -62664 -66.335 66.722 W > Way Sweden. 1838 Dela Bex 2020 31/12 2019 31/12 2018 31/12 2017 31/12 1.42 1.54 1.75 1.47 0.29 0.21 0.25 0.37 0.05 0.11 0.13 0.16 0.14 0.2 0.16 0.54 0.16 0.55 0.55 0.62 0.62 0.66 0.54 0.66 0.67 0.67 0.63 0.72 5.49 6.06 5.13 3.54 5.61 3.98 3.78 4.14 Period Ending: Total Current Assets Cash and Short Term Investments Cash Cash & Equivalents Short Term Investments Total Receivables, Net Accounts Receivables - Trade, Net Total Inventory Prepaid Expenses Other Current Assets, Total Total Assets Property/Plant/Equipment, Total - Net Property/Plant/Equipment, Total - Gross Accumulated Depreciation, Total Goodwill, Net Intangibles, Net Long Term Investments Note Receivable - Long Term Other Long Term Assets, Total Other Assets, Total Total Current Liabilities Accounts Payable Payable/Accrued Accrued Expenses Notes Payable/Short Term Debt Current Port of LT Debt/Capital Leases Other Current liabilities, Total Total Liabilities 0.17 0.17 0.17 0.17 1.29 1.42 1.37 1.48 0.58 0.56 0.55 0.69 0.71 0.86 0.83 0.79 1.69 1.8 1.77 1.88 Total Long Term Deht 1.29 1.42 1.37 1.48 0.58 0.56 0.55 0.69 0.71 0.86 0.83 0.79 1.69 1.8 1.77 1.88 0.24 0.24 0.24 0.24 Total Current Liabilities Accounts Payable Payable/Accrued Accrued Expenses Notes Payable/Short Term Debt Current Port of LT Debt/Capital Leases Other Current liabilities, Total Total Liabilities Total Long Term Debt Long Term Debt Capital Lease Obligations Deferred Income Tax Minority Interest Other Liabilities, Total Total Equity Redeemable Preferred Stock, Total Preferred Stock - Non Redeemable, Net Common Stock, Total Additional Paid-In Capital Retained Earnings (Accumulated Deficit) Treasury Stock - Common ESOP Debt Guarantee Unrealized Gain (Loss) Other Equity, Total Total Liabilities & Shareholders' Equity Total Common Shares Outstanding Total Preferred Shares Outstanding 0.16 0.15 0.16 0.16 3.44 3.69 3.84 4.18 2 2 2 2 0.23 -0.29 -0.04 0.11 0.23 1.73 1.73 1.73 1.73 5.13 5.49 5.61 6.06 20 20 20 20 * In Millions of OMR (except for per share items) DBCI Ratios i Name Company Industry 11.03 1.39 1.38 - 30 P/E Ratio TTM Price to Sales TTM Price to Cash Flow MRQ Price to Free Cash Flow TTM Price to Book MRQ Price to Tangible Book MRQ 248.8 1.51 8.55 2.98 2.98 1.51 40.64% 41.59% 38.56% 40.51% 14.04% -5.7% -2.65% 14.46% Gross margin TTM Gross Margin 5YA Operating margin TTM Operating margin 5YA Pretax margin TTM Pretax margin SYA Net Profit margin TTM Net Profit margin SYA -6.57% 14.33% -3.84% 14.72% -6.57% 12.51% -4.05% 12.94% 0.19 1.47 -0.01 0.18 Revenue/Share TTM Basic EPS ANN Diluted EPS ANN Book Value/Share MRQ Tangible Book Value/Share MRQ -0.01 0.17 0.18 0.68 0.17 0.68 Cash/Share MRQ 0.01 0.22 Cash Flow/Share TTM 0.27 Financial Ratios Financial performance indicators are based on Third Quarter 2020 ROE % 3.36 ROA % 2.27 EPS 0.01 Net Profit Growth % -17.15 Total Assets Growth % -4.93 Book value growth % -4.97 EPS Growth % -17.14 Cash from operations Growth % 1,001.62 ANNOUNCEMENT DATE EFFECTIVE FROM TYPE DESCRIPTION 07 March 2017 02 April 2017 Cash Dividends OGM on 2017-04-13 decided OMR 0.005 dividend payout 18 February 2016 20 March 2016 Cash Dividends OGM on 2016-04-01 decided OMR 0.015 dividend payout 26 February 2015 18 March 2015 Cash Dividends OGM on 2015-04-02 decided OMR 0.01 dividend payout 24 March 2014 24 March 2014 Cash Dividends OGM on 2014-03-24 decided OMR 0.009 dividend payout 04 March 2013 25 March 2013 Cash Dividends OGM on 2013-03-25 decided OMR 0.005 dividend payout for Previous FY DBCI Income Statement >> 6M 40.64% -5.7% 4M Gross margin TTM Operating margin TTM Net Profit margin TTM Return on Investment TTM -6.57% -6.22% 11 1 2M Total Revenue Net Income OM - 2M 2017 2018 2019 2020 Period Ending: Dec 31, 2020 Dec 31, 2018 Dec 31, 2017 3.74 Dec 31, 2019 4.16 1.68 4.38 4.52 1.52 1.73 1.77 Total Revenue Gross Profit Operating Income Net Income -0.21 -0.09 -0.23 -0.21 -0.25 -0.15 -0.33 -0.28 DBCI Balance Sheet >> 7.5M Quick Ratio MRQ Current Ratio MRQ LT Debt to Equity MRQ Total Debt to Equity MRQ 0.58 1.1 0% 20.6% 5M 2.5M Total Assets Total Liabilities -6.9% -4.32% 29.41% 34.21% 15.63% Return on Equity TTM Return on Equity 5YA Return on Assets ITM Return on Assets SYA Return on Investment TTM Return on Investment 5YA -4.63% -3.01% 22.25% -6.22% 24.3% -3.94% 25.22% -37.33% 48.65% -37.28% 11.95% 25.45% EPS(MRO) vs Qtr. 1 Yr. Ago MRQ EPS(TTM) vs TTM 1 Yr. Ago TTM 5 Year EPS Growth SYA Sales (MRO) vs Qtr. 1 Yr. Ago MRQ Sales (TTM) vs TTM 1 Yr. Ago TTM 5 Year Sales Growth SYA 5 Year Capital Spending Growth SYA -8.99% 1.43% -9.89% 4.88% -7.76% 11.13% -16.28% 38.3% 0.58 0.95 1.1 1.25 0% 12.12% 20.6% 42.53% Quick Ratio MRQ Current Ratio MRO LT Debt to Equity MRQ Total Debt to Equity MRQ Efficiency Asset Turnover TTM Inventory Turnover TTM Revenue/Employee TTM Net Income/Employee TTM Receivable Turnover TTM 0.71 1.23 3.31 6.43 6.44 15.66 4.6% 4.28% Dividend Yield ANN Dividend Yield 5 Year Avg. SYA Dividend Growth Rate ANN Payout Ratio TTM 2% 47.13 Summary Charts Company Financials Valuation Fiscal Period: December 2015 2016 2017 2018 2019 2020 5,20 5,20 5,20 5,20 5,20 5,20 Capitalization Entreprise Value (EV) P/E ratio 5,61 5,54 5,63 5,75 5,81 5,74 16,6% 42,3x -18,8x - 16,0x -33,9x -21,1x Yield Capitalization / Revenue 0,93x 1,06x 1,15x 1,19x 1,25x 1,39% EV / Revenue 1,00% 1,13x 1,25x 1,31% 1,40X 1,53x 6,76x 9,78% 35,7% 49,8x 31,8% 137x EV / EBITDA Price to Book 1,10x 1,14x 1,24x 1,35x 1,41x 1,51x 20 000 20 000 20 000 20 000 20 000 20 000 Nbr of stocks (in thousands) Reference price (OMR) Last update 0,26 0,26 0,26 0,26 0,26 0,26 03/08/2017 03/05/2018 03/07/2019 03/01/2020 03/04/2021 03/04/2021 1 OMR in Million 3.96 4.24 4.61 4.73 1.73 1.75 1.86 1.87 0.05 0.1 0.14 0.18 -0.05 -0.08 -0.04 -0.07 -0.21 -0.09 -0.23 -0.21 -0.03 -0.06 -0.09 -0.05 -0.25 -0.15 -0.33 -0.26 0.02 -0.25 -0.15 -0.33 -0.28 Total Operating Expenses Selling/General/Admin. Expenses, Total Research & Development Depreciation / Amortization Interest Expense (Income) - Net Operating Unusual Expense (Income) Other Operating Expenses, Total Operating Income Interest Income (Expense), Net Non-Operating Gain (Loss) on Sale of Assets Other, Net Net Income Before Taxes Provision for Income Taxes Net Income After Taxes Minority Interest Equity In Affiliates U.S GAAP Adjustment Net Income Before Extraordinary Items Total Extraordinary Items Net Income Total Adjustments to Net Income Income Available to Common Excluding Extraordinary Items Dilution Adjustment Diluted Net Income Diluted Weighted Average Shares Diluted EPS Excluding Extraordinary Items DPS - Common Stock Primary Issue Diluted Normalized EPS -0.25 -0.15 -0.33 -0.28 -0.25 -0.15 -0.33 -0.28 -0.25 -0.15 -0.33 -0.28 -0.15 -0.33 -0.28 -0.25 20 20 20 20 -0.01 -0.01 -0.02 -0.01 -0.01 -0.01 -0.02 -0.01 * In Millions of OMR (except for per share items)


