What decision do I make for round 1?
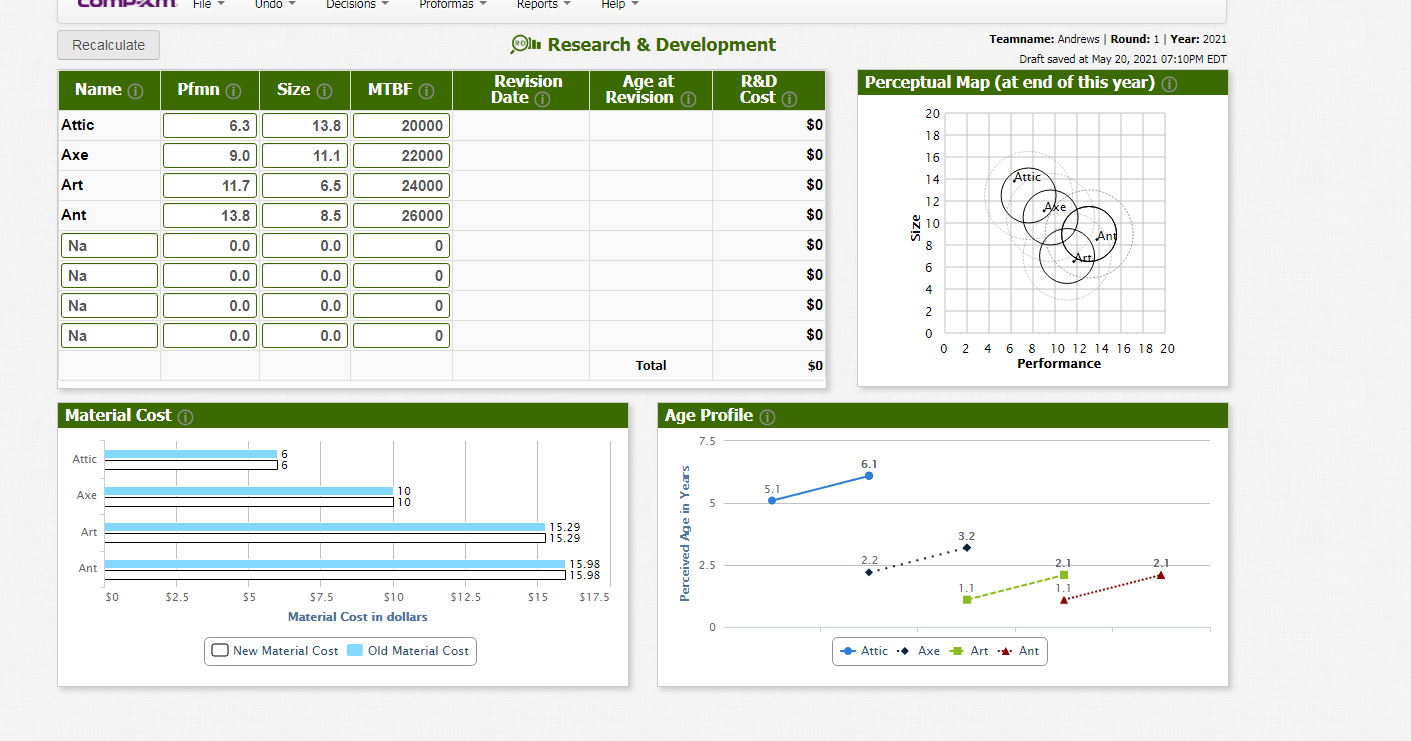
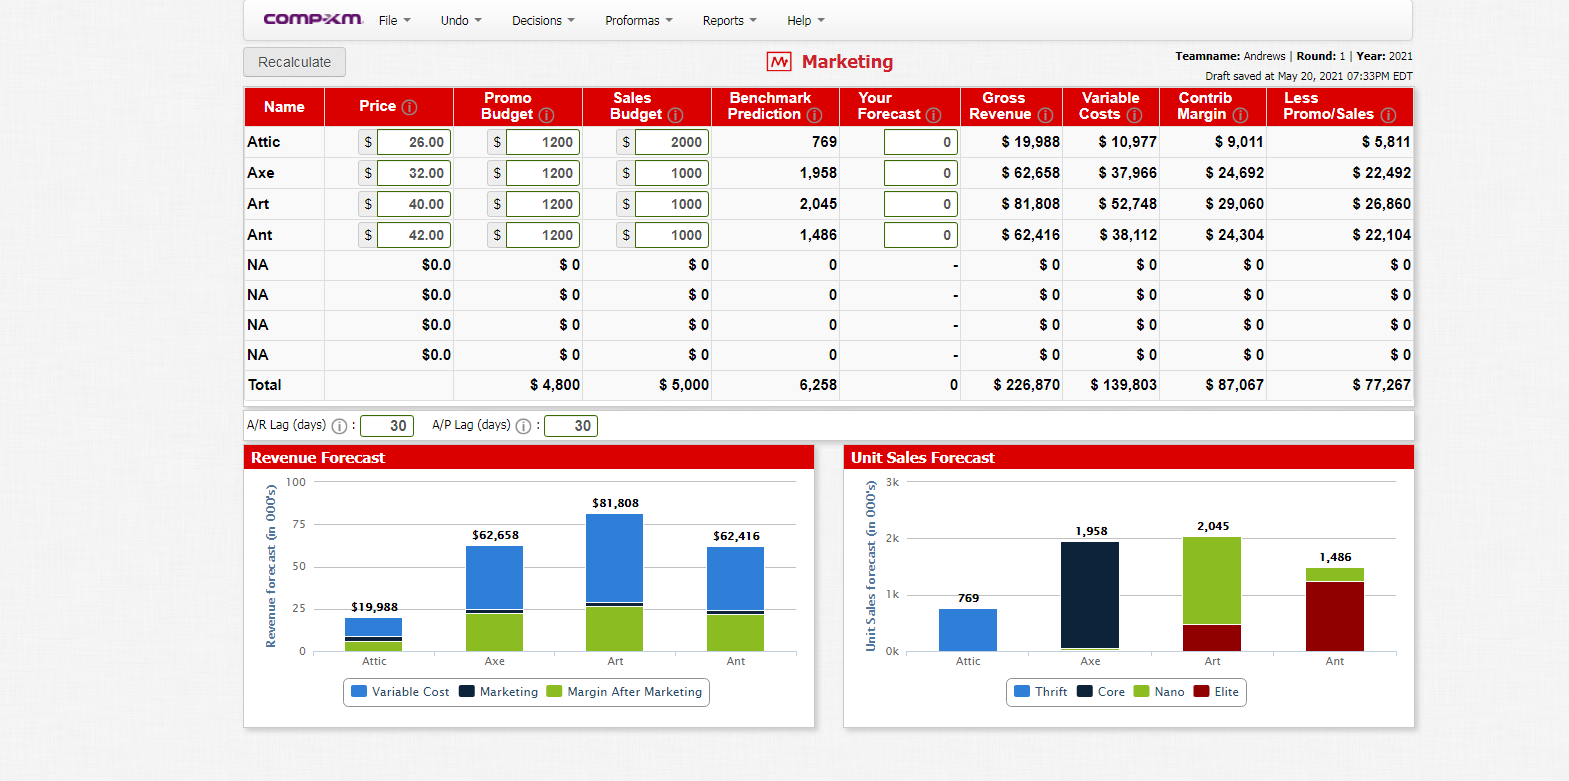
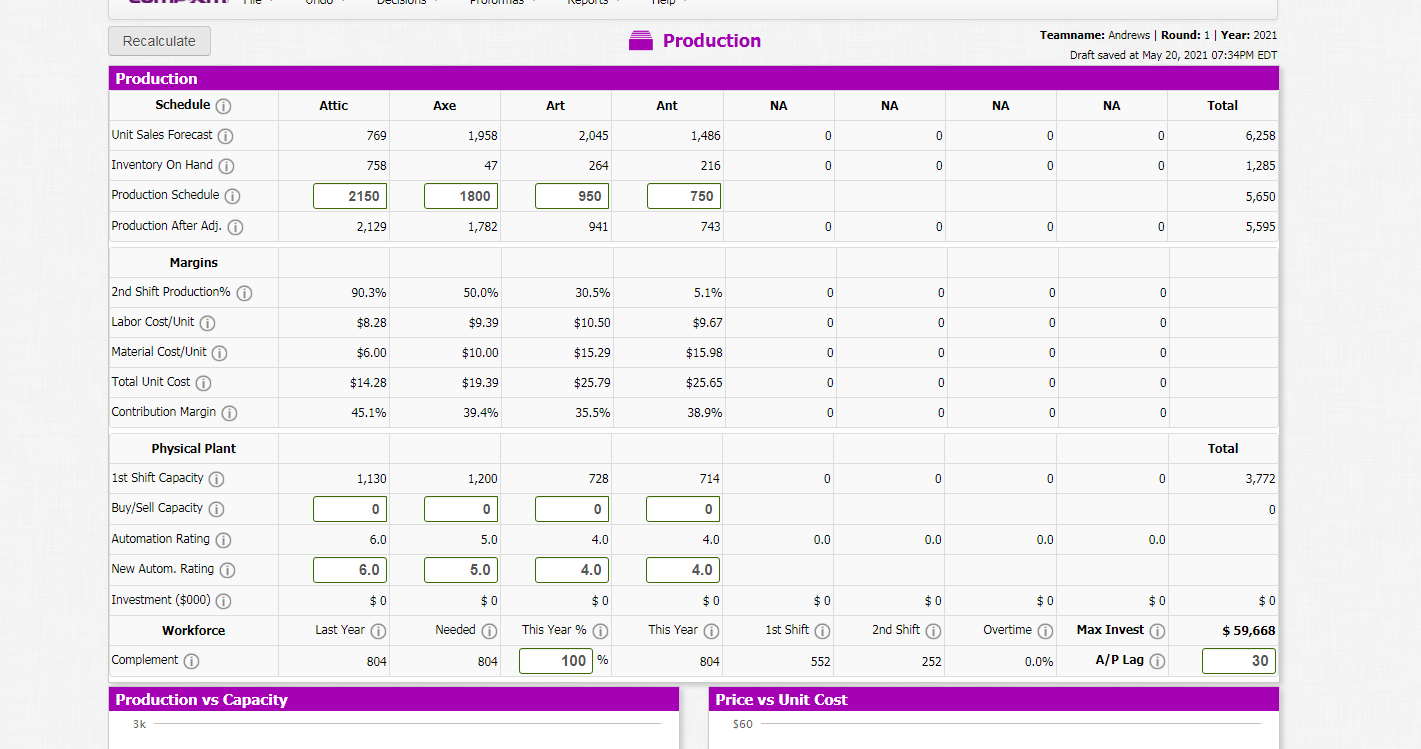
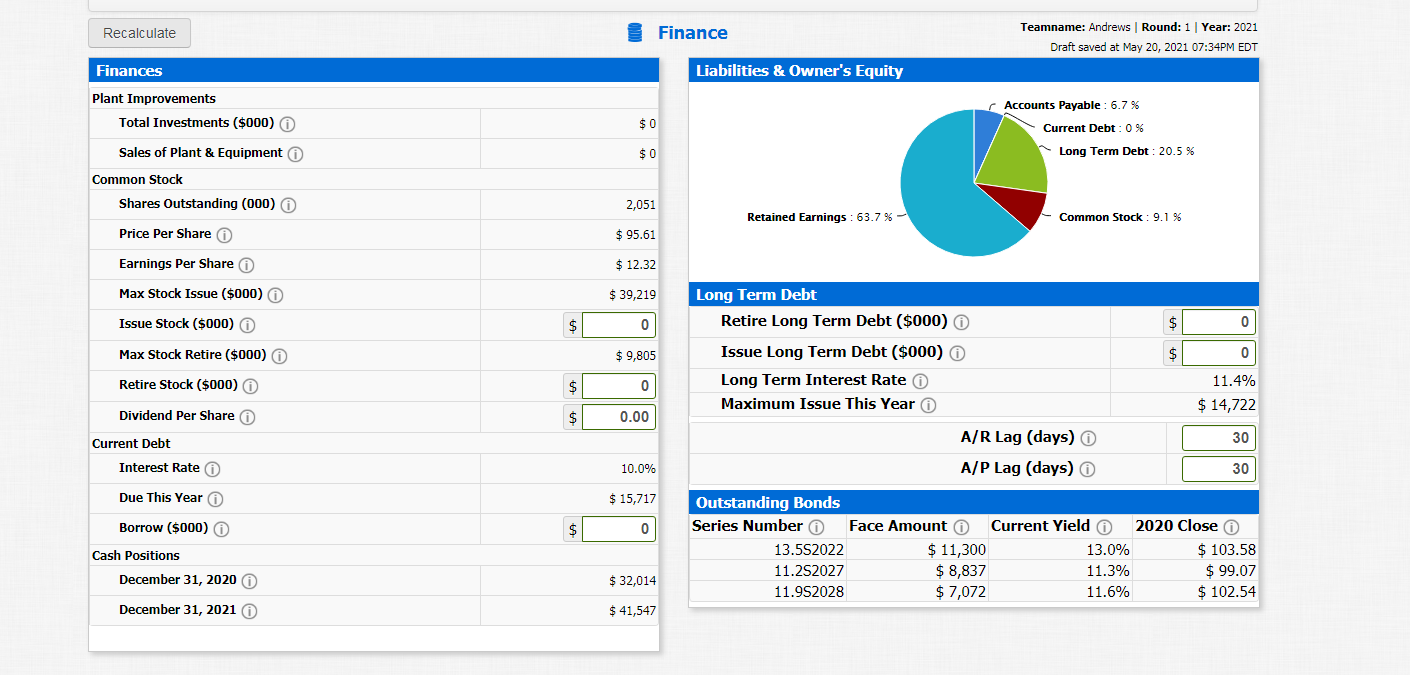
File Undo Decisions Proformas Reports Help Recalculate Oll Research & Development Teamname: Andrews Round: 1 Year: 2021 Draft saved at May 20, 2021 07:10PM EDT Perceptual Map (at end of this year) Name Pfmn Size MTBF O Revision Date 0 Age at Revision R&D Cost 20 Attic 6.3 13.8 20000 $0 18 Axe 9.0 11.1 22000 $0 16 Art 14 11.7 Attic 6.5 $0 24000 12 Ant 13.8 8.5 26000 $0 Ake 10 Any 0.0 0.0 0 $0 8 Na Na 6 0.0 0.0 0 $0 4 4 Na 0.0 0.0 0 $0 2 Na 0.0 0.0 0 $0 0 0 2 4 6 8 10 12 14 16 18 20 Performance Total $0 Material Cost Age Profile 7.5 Attic 6 6 6.1 5.1 Axe 10 10 5 Art 15.29 15.29 Perceived Age in Years 3.2 Ant 2.2 2.5 2.1 15.98 15.98 2.1 1.1 1.1 $0 $2.5 55 $12.5 $15 $17.5 $7.5 $10 Material Cost in dollars 0 O New Material Cost Old Material Cost Attic Axe + Art + Ant comp-xm File - Undo Decisions Proformas Reports Help Recalculate M Marketing Teamname: Andrews Round: 1 Year: 2021 Draft saved at May 20, 2021 07:33PM EDT Contrib Less Margin 0 Promo/Sales Name Price Promo Budget Sales Budget Benchmark Prediction Your Forecast Gross Revenue o Variable Costs $ 10,977 Attic 26.00 $ 1200 $ 2000 769 0 $ 19,988 $ 9,011 $ 5,811 Axe $ 32.00 $ 1200 $ 1000 1,958 0 $ 62,658 $ 37,966 $ 24,692 $ 22,492 Art $ 40.00 $ 1200 $ 1000 2,045 0 $ 81,808 $ 52,748 $ 29,060 $ 26,860 Ant $ 42.00 $ 1200 $ 1000 1,486 0 $ 62,416 $ 38,112 $ 24,304 $ 22,104 $0 NA $0.0 $0 $ 0 0 $0 $ 0 $0 NA $0.0 $0 $0 0 $ 0 $0 $0 $0 NA $0.0 $0 $ 0 0 $ 0 $ 0 $0 $0 NA $0.0 $0 $ 0 0 $0 $ 0 $ 0 $ 0 Total $ 4,800 $ 5,000 6,258 0 $ 226,870 $ 139,803 $ 87,067 $ 77,267 A/R Lag (days) 0:1 30 A/P Lag (days) :1 30 Revenue Forecast Unit Sales Forecast 100 k $81,808 75 $62,658 $62,416 2,045 2K 1,958 1,486 Revenue forecast (in 000's) 50 Unit Sales forecast (in 000's) Ik 769 25 $19,988 0 OK Attic Axe Art Ant Attic Axe Art Ant Variable Cost Marketing Margin After Marketing Thrift Core Nano Elite Recalculate Production Teamname: Andrews Round: 1 Year: 2021 Draft saved at May 20, 2021 07:34PM EDT Production Schedule Attic Axe Art Ant NA NA NA NA Total Unit Sales Forecast 769 1,958 2,045 1,486 0 0 0 0 6,258 Inventory On Hand 758 47 264 216 0 0 0 0 1,285 Production Schedule 2150 1800 950 750 5,650 Production After Adj. 2,129 1,782 941 743 0 0 0 0 5,595 Margins 2nd Shift Production% 90.3% 50.0% 30.5% 5.1% 0 0 0 0 Labor Cost/Unit $8.28 $9.39 $10.50 $9.67 0 0 0 0 Material Cost/Unit $6.00 $10.00 $15.29 $15.98 0 0 0 0 0 Total Unit Cost $14.28 $19.39 $25.79 $25.65 0 0 0 0 Contribution Margin 45.1% 39.4% 35.5% 38.9% 0 0 0 0 Physical Plant Total 1st Shift Capacity 1,130 1,200 728 714 0 0 0 0 3,772 Buy/Sell Capacity 0 0 0 0 0 Automation Rating 6.0 5.0 4.0 4.0 0.0 0.0 0.0 0.0 New Autom. Rating 6.0 5.0 4.0 4.0 Investment ($000) O $ 0 $ 0 $ 0 $0 $ 0 $ 0 $ 0 $0 $ 0 Workforce Last Year Needed This Year % This Year 1st Shift 2nd Shift Overtime Max Invest $ 59,668 Complement 804 804 100 % 804 552 252 0.0% A/P Lag 30 Price vs Unit Cost Production vs Capacity 3k 560 Recalculate Finance Teamname: Andrews | Round: 1 Year: 2021 Draft saved at May 20, 2021 07:34PM EDT Finances Liabilities & Owner's Equity Plant Improvements Total Investments ($000) O $0 Accounts Payable : 6.7 % Current Debt: 0% Long Term Debt: 20.5% Sales of Plant & Equipment $0 Common Stock Shares Outstanding (000) 2,051 Retained Earnings : 63.7% Common Stock: 9.1 % $ 95.61 Price Per Share o Earnings Per Share o $ 12.32 Max Stock Issue ($000) $ 39,219 Issue Stock (5000) $ 0 S 0 Max Stock Retire ($000) $ 9,805 $ 0 Retire Stock ($000) $ 0 Long Term Debt Retire Long Term Debt ($000) O Issue Long Term Debt ($000) O Long Term Interest Rate Maximum Issue This Year A/R Lag (days) A/P Lag (days) 11.4% $ 14,722 Dividend Per Share $ 0.00 30 Current Debt Interest Rate 10.0% 30 Due This Year $ 15,717 Borrow ($000) $ 0 Cash Positions December 31, 2020 Outstanding Bonds Series Number Face Amount Current Yield 2020 Close 13.5S2022 $ 11,300 13.0% $ 103.58 11.252027 $ 8,837 11.3% $ 99.07 11.9S2028 $ 7,072 11.6% $ 102.54 $ 32,014 December 31, 2021 $ 41,547 File Undo Decisions Proformas Reports Help Recalculate Oll Research & Development Teamname: Andrews Round: 1 Year: 2021 Draft saved at May 20, 2021 07:10PM EDT Perceptual Map (at end of this year) Name Pfmn Size MTBF O Revision Date 0 Age at Revision R&D Cost 20 Attic 6.3 13.8 20000 $0 18 Axe 9.0 11.1 22000 $0 16 Art 14 11.7 Attic 6.5 $0 24000 12 Ant 13.8 8.5 26000 $0 Ake 10 Any 0.0 0.0 0 $0 8 Na Na 6 0.0 0.0 0 $0 4 4 Na 0.0 0.0 0 $0 2 Na 0.0 0.0 0 $0 0 0 2 4 6 8 10 12 14 16 18 20 Performance Total $0 Material Cost Age Profile 7.5 Attic 6 6 6.1 5.1 Axe 10 10 5 Art 15.29 15.29 Perceived Age in Years 3.2 Ant 2.2 2.5 2.1 15.98 15.98 2.1 1.1 1.1 $0 $2.5 55 $12.5 $15 $17.5 $7.5 $10 Material Cost in dollars 0 O New Material Cost Old Material Cost Attic Axe + Art + Ant comp-xm File - Undo Decisions Proformas Reports Help Recalculate M Marketing Teamname: Andrews Round: 1 Year: 2021 Draft saved at May 20, 2021 07:33PM EDT Contrib Less Margin 0 Promo/Sales Name Price Promo Budget Sales Budget Benchmark Prediction Your Forecast Gross Revenue o Variable Costs $ 10,977 Attic 26.00 $ 1200 $ 2000 769 0 $ 19,988 $ 9,011 $ 5,811 Axe $ 32.00 $ 1200 $ 1000 1,958 0 $ 62,658 $ 37,966 $ 24,692 $ 22,492 Art $ 40.00 $ 1200 $ 1000 2,045 0 $ 81,808 $ 52,748 $ 29,060 $ 26,860 Ant $ 42.00 $ 1200 $ 1000 1,486 0 $ 62,416 $ 38,112 $ 24,304 $ 22,104 $0 NA $0.0 $0 $ 0 0 $0 $ 0 $0 NA $0.0 $0 $0 0 $ 0 $0 $0 $0 NA $0.0 $0 $ 0 0 $ 0 $ 0 $0 $0 NA $0.0 $0 $ 0 0 $0 $ 0 $ 0 $ 0 Total $ 4,800 $ 5,000 6,258 0 $ 226,870 $ 139,803 $ 87,067 $ 77,267 A/R Lag (days) 0:1 30 A/P Lag (days) :1 30 Revenue Forecast Unit Sales Forecast 100 k $81,808 75 $62,658 $62,416 2,045 2K 1,958 1,486 Revenue forecast (in 000's) 50 Unit Sales forecast (in 000's) Ik 769 25 $19,988 0 OK Attic Axe Art Ant Attic Axe Art Ant Variable Cost Marketing Margin After Marketing Thrift Core Nano Elite Recalculate Production Teamname: Andrews Round: 1 Year: 2021 Draft saved at May 20, 2021 07:34PM EDT Production Schedule Attic Axe Art Ant NA NA NA NA Total Unit Sales Forecast 769 1,958 2,045 1,486 0 0 0 0 6,258 Inventory On Hand 758 47 264 216 0 0 0 0 1,285 Production Schedule 2150 1800 950 750 5,650 Production After Adj. 2,129 1,782 941 743 0 0 0 0 5,595 Margins 2nd Shift Production% 90.3% 50.0% 30.5% 5.1% 0 0 0 0 Labor Cost/Unit $8.28 $9.39 $10.50 $9.67 0 0 0 0 Material Cost/Unit $6.00 $10.00 $15.29 $15.98 0 0 0 0 0 Total Unit Cost $14.28 $19.39 $25.79 $25.65 0 0 0 0 Contribution Margin 45.1% 39.4% 35.5% 38.9% 0 0 0 0 Physical Plant Total 1st Shift Capacity 1,130 1,200 728 714 0 0 0 0 3,772 Buy/Sell Capacity 0 0 0 0 0 Automation Rating 6.0 5.0 4.0 4.0 0.0 0.0 0.0 0.0 New Autom. Rating 6.0 5.0 4.0 4.0 Investment ($000) O $ 0 $ 0 $ 0 $0 $ 0 $ 0 $ 0 $0 $ 0 Workforce Last Year Needed This Year % This Year 1st Shift 2nd Shift Overtime Max Invest $ 59,668 Complement 804 804 100 % 804 552 252 0.0% A/P Lag 30 Price vs Unit Cost Production vs Capacity 3k 560 Recalculate Finance Teamname: Andrews | Round: 1 Year: 2021 Draft saved at May 20, 2021 07:34PM EDT Finances Liabilities & Owner's Equity Plant Improvements Total Investments ($000) O $0 Accounts Payable : 6.7 % Current Debt: 0% Long Term Debt: 20.5% Sales of Plant & Equipment $0 Common Stock Shares Outstanding (000) 2,051 Retained Earnings : 63.7% Common Stock: 9.1 % $ 95.61 Price Per Share o Earnings Per Share o $ 12.32 Max Stock Issue ($000) $ 39,219 Issue Stock (5000) $ 0 S 0 Max Stock Retire ($000) $ 9,805 $ 0 Retire Stock ($000) $ 0 Long Term Debt Retire Long Term Debt ($000) O Issue Long Term Debt ($000) O Long Term Interest Rate Maximum Issue This Year A/R Lag (days) A/P Lag (days) 11.4% $ 14,722 Dividend Per Share $ 0.00 30 Current Debt Interest Rate 10.0% 30 Due This Year $ 15,717 Borrow ($000) $ 0 Cash Positions December 31, 2020 Outstanding Bonds Series Number Face Amount Current Yield 2020 Close 13.5S2022 $ 11,300 13.0% $ 103.58 11.252027 $ 8,837 11.3% $ 99.07 11.9S2028 $ 7,072 11.6% $ 102.54 $ 32,014 December 31, 2021 $ 41,547


