Answered step by step
Verified Expert Solution
Question
1 Approved Answer
please solve AEO ratios I need all of the ratios. inventory turnover ratio, gross profit ratio for multiple yes, operating expense ratio, debt to equity
please solve AEO ratios 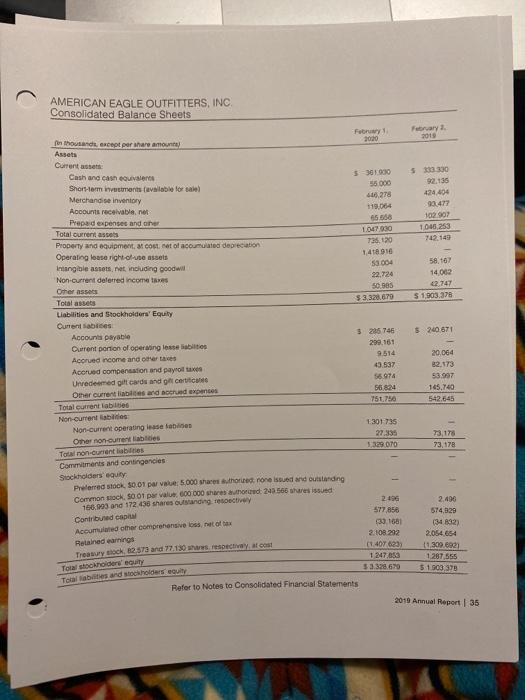

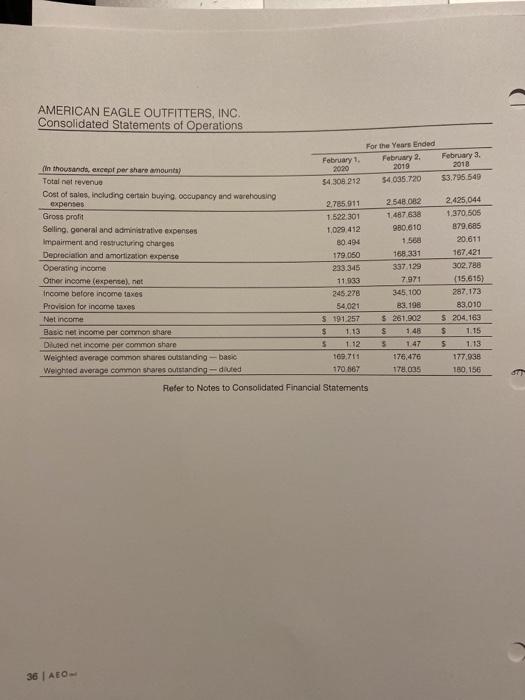
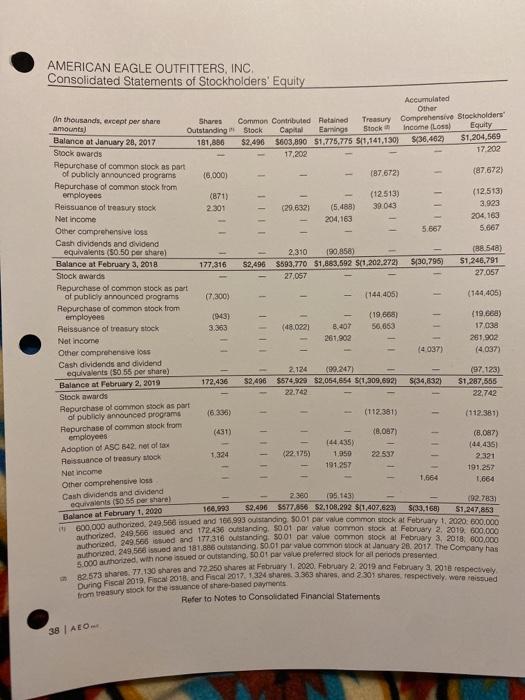
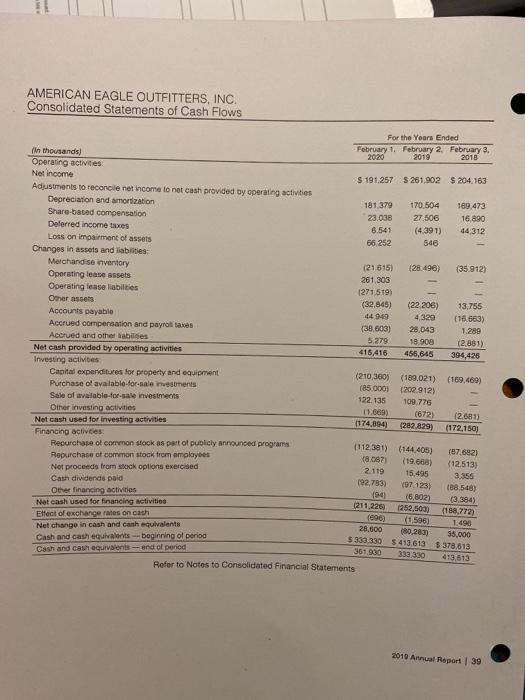
I need all of the ratios. inventory turnover ratio, gross profit ratio for multiple yes, operating expense ratio, debt to equity ratio, return to equity, current year earnings yeild
AMERICAN EAGLE OUTFITTERS, INC Consolidated Balance Sheets February 2018 424 404 9042 102.907 1040.253 58.167 14.002 2.747 $ 1,903.378 $240.671 Febrwys thousand except per share amount 3000 Assets Current as Cash and cash equivalen 5301930 Short-term investments available for sale 55000 Merchandise Inventory 46.278 Accounts receivable.net 119.064 Prepad expenses and one 65.650 Total current assos 1.047930 Property and equipment cost of accurate depreciation 735.120 Operating lase rights assets 1,41890 Intangible assets, net including goodwill $3004 Non-current deferred income taxes 22.724 Other asses 50.985 Total assets $ 3.328.6.70 Liabilities and Stockholders' Equity Current abies Accounts payable 3205746 Current portion of operating losse bites 299,161 Acored income and other faces 9.514 Acored compensation and payroll 49.537 Urvedemedit cards and certo 56 OTA Other current liable and socrud expenses 56824 Total current labi 751.786 Non-current abans Non-current operating sebe 1301 735 Other non current liabides 27.335 Total non-current liabilities 1.329.070 Commitments and contingencies Stockholders equity Preferred stock 30.01 par 5.000 share those non sedard outstanding Common stock, SO 01 per value 600.000 shares wordt 243566 shares issued 166,993 and 172.436 shares outstanding respective 2496 Contribuc 577 856 Accumud other comprehensive set of tax 30.1561 Retained earnings 2.108 292 Treasury ok. 82.573 and 77.130 respectiva al cost (1.407623 1 247.653 Toa stockholders' equity 33.328.6 Tools and stockholders equity Refer to Notes to Consolidated Financial Statements 20,064 82173 53.997 165.140 542.645 3,176 73,178 1 2.496 574,929 134 832) 2054654 11.309.6921 1 287 555 5 1 303 378 2010 Annual Report 35 AMERICAN EAGLE OUTFITTERS, INC. Consolidated Statements of Operations For the Year Ended February 1, February 2 February 3, in thousands, except per share amounta) 2020 2019 2018 Total net revenue 54,300 212 54.035.720 53.795 540 Cost of sales including certain buying occupancy and warehousing expenses 2,785,911 254B 02 2.425,044 Gross profit 1.522.301 1.487 638 1,370.505 Selling general and administrative expenses 1.029 412 980.610 379,685 Impairment and restructuring charges 80.494 1588 20.611 Depreciation and amortization expense 179.050 168 331 167,421 Operating income 233 345 337.129 302.780 Other income (expensel.net 11.933 7971 (15.615) Income before income taxes 245 278 345 100 287 173 Provision for income taxes 54,021 B3.198 83,010 Net income $ 191.257 $ 261.902 5 204.163 Basic net income per non share $ 1.13 $ 1.48 $ 1.15 Diluted net income per common share 5 1 12 5 1 47 5 Weighted average common shares outstanding - basic 102.711 176.476 177.938 Weighted average common shares outstanding-duled 170 567 178,035 180, 156 Refer to Notes to Consolidated Financial Statements 36 AEO- AMERICAN EAGLE OUTFITTERS, INC Consolidated Statements of Stockholders' Equity 81111 Accumulated Other On thousands, except per share Shares Common Contributed Retained Treasury Comprehensive Stockholders' amounta) Outstanding Stock Capit Earnings Stock Income Loss Equity Balance at January 28, 2017 181,886 $2.496 5603,890 51,775,775 $11,141,130) $(36.462) $1,204,569 Stock owards 17,200 17.202 Repurchase of common stock as part of publicly announced programs (5,000) 187.672) (87.672) Repurchase of common stock from emoloyees (871) (12.513) (12.513) Reissuance of treasury stock 2301 (29.6321 (5,488) 39 043 3.923 Nat income 204,163 204,163 Other comprehensive loss 5.667 5.667 Cash dividends and dividend equivalents (50.50 per sharel 2,310 190,858) (88.548) Balance at February 3, 2018 177.316 S2,496 $593,770 $1,883,592 $(1,202.272) $130,795 $1,246,791 Stock awards 27,067 27 057 Repurchase of common stock as part of publicly announced programs (7.300) (144,405) (144.405) Repurchase of common stock from employees (943) (19,6637 19.068) Reissuance of treasury stock 3.363 (48.0221 8.407 56,663 17.038 Not Income 261.002 251.902 Other comprehensive loss (4 037) (4.037) Cash dividends and dividend equivalents (50 55 por share) 2.124 (99,247) (97.128) Balance at February 2, 2019 172,436 $2,496 $574,929 $2,064,654 ${1,309,6921 ${34,832) $1,287,555 Stock awards 22.742 22.742 Repurchase of common stock as part (6.335) of publicly announced programs (112.3813 (112.381) Repurchase of common Mock from (451) employees (8,087) (8,087) (44 435) Adoption of ASC 542.net ofta (44,4361 1.324 (22.175) 1.950 Reissuance of treasury shock 22.537 2321 191 257 Not income 191,257 1,664 1664 2360 195.143) (92.7831 166,993 52,406 5577,856 52.108,292 $11,407,623) $(33.16) $1,247,853 600,000 authorized 249,900 issued and 100003 odstanding of our value common stock at February 1, 2000.000.000 authorized 209 566 Od and 177 316 outstanding S001 pat value common stock a February 3, 2018, 800.000 authorized 249,5e lasued and 181.866 canairgo Corporate for lary 28, 2017 The Company has 5.000 authorized with one sued or outstanding to per value preferred stock for all periode preserted 2573 shares. 77.130 shares and 72 250 shares February 1, 2020. February 2, 2019 and February 3, 2016 respectively Bering Fiscal 2019. Focal 2018 and Forcal 2017 a 3.33 shares, and 230 shares, respectively were rescued from treasury stock for the issuance of share-based payments Refer to Notes to Consolidated Financial Statements -- 11 Other comprehensive loss Cash dividends and dividend equivalents (50 55 per share) Balance at February 1, 2020 38 ATO AMERICAN EAGLE OUTFITTERS, INC. Consolidated Statements of Cash Flows For the Years Ended February 1 February 2, February 3, In thousands) 2020 2019 2018 Operating activities Net Income S 191.257 S 261,902 $ 204.163 Adjustments to reconcile net income to net cash provided by operating activities Depreciation and amortization 181379 170504 189.473 Share-based compensation 23.038 27.506 16890 Deferred income taxes 6.541 (4391) 44 312 Loss on impairment of assets 66 252 546 Changes in assets and liabilities: Merchandise inventory (21615 (28.490) (35.9123 Operating lease assets 261,303 Operating tease liabilities 1271519) Other assets (32,845) (22.206) 13,755 Accounts payable 44 949 (16.663) Accrued compensation and payroll taxes (38.603) 28,043 1.289 Accrued and other babies 5.279 18.908 (2.881) Net cash provided by operating activities 416,416 456,645 394,426 Investing activites Capital expenditures for property and equipment (210,360) (189.021) (169.469) Purchase of available for sale investments (850001 1202 912) Sale of available for sale investments 122135 109.776 Other investing activities 11 669) (672) (2.6811 Net cash used for investing activities 1174,894) (262.829) (172.150) Financing activities Repurchase of common stock as part of publicly announced programs (112381) (144405) (87.882) Repurchase of common stock from employees 18.087) (19.658) (12.513) Not proceeds from stock options exercised 2.119 15.495 3.356 Cash dividends paid 192,783) 07.123) (88.548) Other financing activities 1941 (6.802 Net cash used for financing activities (211.226 (252.500) (188,772 Effect of exchange rates on cash (296) (1506) 1,490 Net change in cash and cash equivalents 28.600 (80.26.31 35,000 Cash and cash equivalents beginning of period $330 330 5413,613 $ 379,613 Cash and cash events-end of period 361930 333 330 413.513 Refer to Notes to Consolidated Financial Statements (3.384) 2019 Annual Report 39 Step by Step Solution
There are 3 Steps involved in it
Step: 1

Get Instant Access to Expert-Tailored Solutions
See step-by-step solutions with expert insights and AI powered tools for academic success
Step: 2

Step: 3

Ace Your Homework with AI
Get the answers you need in no time with our AI-driven, step-by-step assistance
Get Started


