Answered step by step
Verified Expert Solution
Link Copied!

Question

1 Approved Answer

please solve all For the normal probability plot shown below, the correlation between the random variable X and expected z-scores is 0.889. Determine whether the

please solve all
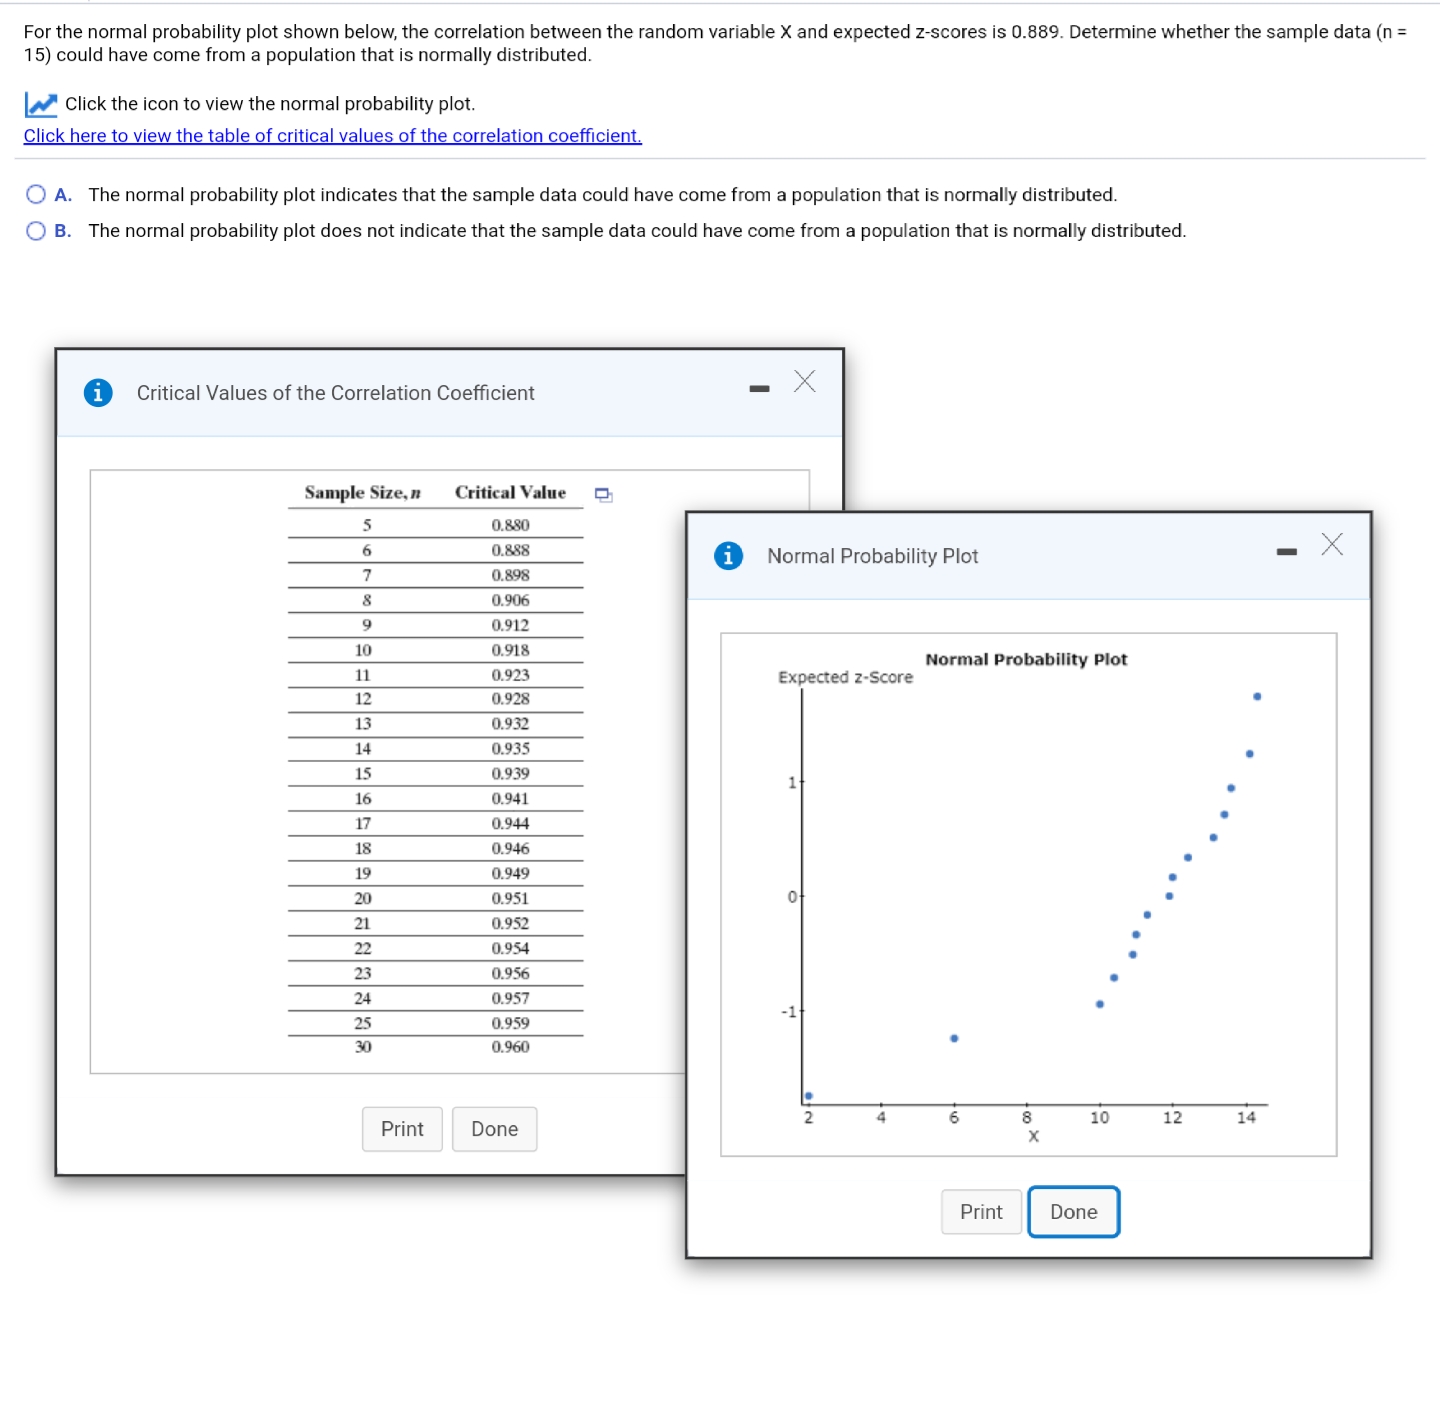
image text in transcribed
For the normal probability plot shown below, the correlation between the random variable X and expected z-scores is 0.889. Determine whether the sample data (n = 15) could have come from a population that is normally distributed. Click the icon to view the normal probability plot. Click here to view the table of critical values of the correlation coefficient. O A. The normal probability plot indicates that the sample data could have come from a population that is normally distributed. O B. The normal probability plot does not indicate that the sample data could have come from a population that is normally distributed. i Critical Values of the Correlation Coefficient X Sample Size, n Critical Value 0.880 6 0.888 i Normal Probability Plot - X 7 0.898 8 0.906 9 0.912 10 0.918 11 0.923 Expected z-Score Normal Probability Plot 12 0.928 0.932 0.935 0.939 0.941 1 0.944 0.946 0.949 0.951 0 0.952 0.954 0.956 0.957 0.959 -1 . 0.960 Print Done 6 10 12 14 Print Done

Step by Step Solution

There are 3 Steps involved in it

Step: 1

blur-text-image

Get Instant Access to Expert-Tailored Solutions

See step-by-step solutions with expert insights and AI powered tools for academic success

Step: 2

blur-text-image_2

Step: 3

blur-text-image_3

Ace Your Homework with AI

Get the answers you need in no time with our AI-driven, step-by-step assistance

Get Started

Recommended Textbook for

An Introduction to the Mathematics of financial Derivatives

Authors: Salih N. Neftci

2nd Edition

978-0125153928, 9780080478647, 125153929, 978-0123846822

More Books

Students also viewed these Mathematics questions