Answered step by step
Verified Expert Solution
Question
1 Approved Answer
Please solve all parts to get upvote and send answer An education researcher has been studying test anxiety using a particular measure, which she administers
Please solve all parts to get upvote and send answer
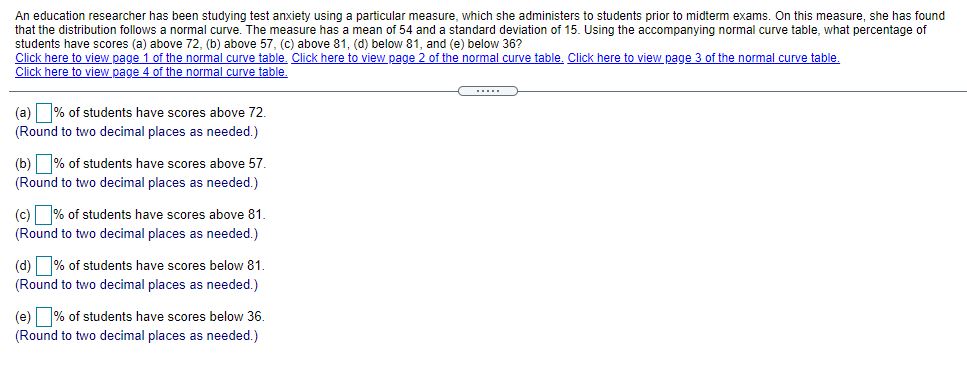
An education researcher has been studying test anxiety using a particular measure, which she administers to students prior to midterm exams. On this measure, she has found that the distribution follows a normal curve. The measure has a mean of 54 and a standard deviation of 15. Using the accompanying normal curve table, what percentage of students have scores (a) above ?2, (b) above 5?, (c) above 31, (d) below 81, and (e) below 36? Click here to view page 1 of the normal curve table. Click here to view page 2 o! the normal curve table. Click here to view page 3 ofthe normal curve taole. Click here to view page 4 oithe normal curve table. f ..... 1 (a) to of students have scores above Y2. (Round to two decimal places as needed.) (b) 'tl: of students have scores above 57. (Round to two decimal places as needed.) (c) 'N; of students have scores above 81. (Round to two decimal places as needed.) (d) to of students have scores beIow 81. (Round to two decimal places as needed.) (e) 'lla of students have scores below 35. (Round to two decimal places as needed.)Step by Step Solution
There are 3 Steps involved in it
Step: 1
Get Instant Access to Expert-Tailored Solutions
See step-by-step solutions with expert insights and AI powered tools for academic success
Step: 2
Step: 3
Ace Your Homework with AI
Get the answers you need in no time with our AI-driven, step-by-step assistance
Get Started