Answered step by step
Verified Expert Solution
Question
1 Approved Answer
please solve and show work TOTAL DISTANCE = 10,2004. Dev DENSITY > 98.3 lblcf Dey DENSIT max 124.5 lblcf Penso 0 Balance lines l) Swell
please solve and show work 

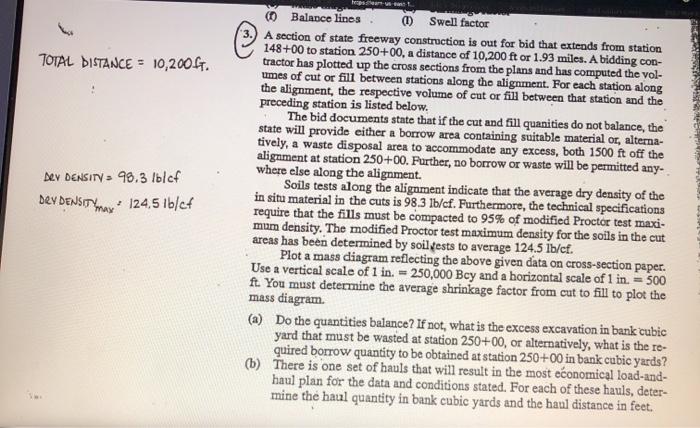
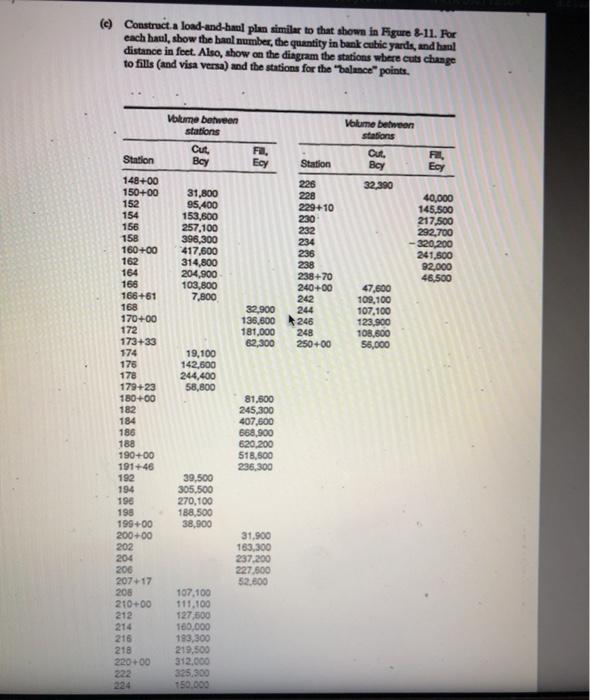
TOTAL DISTANCE = 10,2004. Dev DENSITY > 98.3 lblcf Dey DENSIT max 124.5 lblcf Penso 0 Balance lines l) Swell factor A section of state freeway construction is out for bid that extends from station 148+00 to station 250+00, a distance of 10,200 ft or 1.93 miles. A bidding con- tractor has plotted up the cross sections from the plans and has computed the vol- umes of cut or fill between stations along the alignment. For each station along the alignment, the respective volume of cut or fill between that station and the preceding station is listed below. The bid documents state that if the cut and fill quanities do not balance, the state will provide either a borrow area containing suitable material or, alterna- tively, a waste disposal area to accommodate any excess, both 1500 ft off the alignment at station 250+00. Further, no borrow or waste will be permitted any. where else along the alignment. Soils tests along the alignment indicate that the average dry density of the in situ material in the cuts is 98.3 lb/cf. Furthermore, the technical specifications require that the fills must be compacted to 95% of modified Proctor test maxi- mam density. The modified Proctor test maximum density for the soils in the cut areas has been determined by soil tests to average 124.5 lb/cf. Plot a mass diagram reflecting the above given data on cross-section paper. Use a vertical scale of 1 in. = 250,000 Bcy and a horizontal scale of 1 in. = 500 ft. You must determine the average shrinkage factor from cut to fill to plot the mass diagram. (a) Do the quantities balance? If not, what is the excess excavation in bank cubic yard that must be wasted at station 250+00, or alternatively, what is the re- quired borrow quantity to be obtained at station 250+00 in bank cubic yards? (b) There is one set of hauls that will result in the most economical load-and- haul plan for the data and conditions stated. For each of these hauls, deter- mine the haul quantity in bank cubic yards and the haul distance in feet. (c) Construct a load-and-haul plan similar to that shown in Figure 8-11. For each haul, show the banl number, the quantity in bank cubic yards, and haul distance in feet. Also, show on the diagram the stations were cuts change to fills (and visa versa) and the stations for the balance points. Volume beveen stations Volume between stations Cut Bcy Cut, Boy 2 Station F. Ecy Station Ecy 226 228 32,390 31,800 95,400 153,600 257,100 396,300 417,600 314,800 204,900 103,800 7,800 229+10 230 232 234 236 238 238 +70 240+00 242 244 246 248 250+00 40,000 145.500 217,500 292,700 -320,200 241,500 92.000 46.500 32.900 135,600 181,000 62,300 47,600 109,100 107,100 123,900 108,800 55,000 19,100 142,500 244,400 58,800 148+00 150+00 152 154 156 158 160+00 162 164 166 166+61 168 170-00 172 173+33 174 176 178 179+23 180+00 182 184 186 188 190+00 191+46 192 194 190 198 199+00 200+00 202 204 200 20717 205 210+00 212 214 216 218 220+00 222 81,500 245,300 407,600 668,900 620,200 518,500 236,300 39,500 305.500 270,100 188,500 38,900 31,900 163.300 237.200 227.500 52.600 107.100 111,100 127,500 100,000 193,300 219,500 312.000 325,300 150.000 TOTAL DISTANCE = 10,2004. Dev DENSITY > 98.3 lblcf Dey DENSIT max 124.5 lblcf Penso 0 Balance lines l) Swell factor A section of state freeway construction is out for bid that extends from station 148+00 to station 250+00, a distance of 10,200 ft or 1.93 miles. A bidding con- tractor has plotted up the cross sections from the plans and has computed the vol- umes of cut or fill between stations along the alignment. For each station along the alignment, the respective volume of cut or fill between that station and the preceding station is listed below. The bid documents state that if the cut and fill quanities do not balance, the state will provide either a borrow area containing suitable material or, alterna- tively, a waste disposal area to accommodate any excess, both 1500 ft off the alignment at station 250+00. Further, no borrow or waste will be permitted any. where else along the alignment. Soils tests along the alignment indicate that the average dry density of the in situ material in the cuts is 98.3 lb/cf. Furthermore, the technical specifications require that the fills must be compacted to 95% of modified Proctor test maxi- mam density. The modified Proctor test maximum density for the soils in the cut areas has been determined by soil tests to average 124.5 lb/cf. Plot a mass diagram reflecting the above given data on cross-section paper. Use a vertical scale of 1 in. = 250,000 Bcy and a horizontal scale of 1 in. = 500 ft. You must determine the average shrinkage factor from cut to fill to plot the mass diagram. (a) Do the quantities balance? If not, what is the excess excavation in bank cubic yard that must be wasted at station 250+00, or alternatively, what is the re- quired borrow quantity to be obtained at station 250+00 in bank cubic yards? (b) There is one set of hauls that will result in the most economical load-and- haul plan for the data and conditions stated. For each of these hauls, deter- mine the haul quantity in bank cubic yards and the haul distance in feet. (c) Construct a load-and-haul plan similar to that shown in Figure 8-11. For each haul, show the banl number, the quantity in bank cubic yards, and haul distance in feet. Also, show on the diagram the stations were cuts change to fills (and visa versa) and the stations for the balance points. Volume beveen stations Volume between stations Cut Bcy Cut, Boy 2 Station F. Ecy Station Ecy 226 228 32,390 31,800 95,400 153,600 257,100 396,300 417,600 314,800 204,900 103,800 7,800 229+10 230 232 234 236 238 238 +70 240+00 242 244 246 248 250+00 40,000 145.500 217,500 292,700 -320,200 241,500 92.000 46.500 32.900 135,600 181,000 62,300 47,600 109,100 107,100 123,900 108,800 55,000 19,100 142,500 244,400 58,800 148+00 150+00 152 154 156 158 160+00 162 164 166 166+61 168 170-00 172 173+33 174 176 178 179+23 180+00 182 184 186 188 190+00 191+46 192 194 190 198 199+00 200+00 202 204 200 20717 205 210+00 212 214 216 218 220+00 222 81,500 245,300 407,600 668,900 620,200 518,500 236,300 39,500 305.500 270,100 188,500 38,900 31,900 163.300 237.200 227.500 52.600 107.100 111,100 127,500 100,000 193,300 219,500 312.000 325,300 150.000 

Step by Step Solution
There are 3 Steps involved in it
Step: 1

Get Instant Access to Expert-Tailored Solutions
See step-by-step solutions with expert insights and AI powered tools for academic success
Step: 2

Step: 3

Ace Your Homework with AI
Get the answers you need in no time with our AI-driven, step-by-step assistance
Get Started


