Answered step by step
Verified Expert Solution
Link Copied!

Question

1 Approved Answer

Please solve as soon as possible Q3 (a): The data represent the values in billions of dollars of the damage of 10 hurricanes. 1.1, 1.7,

Please solve as soon as possible
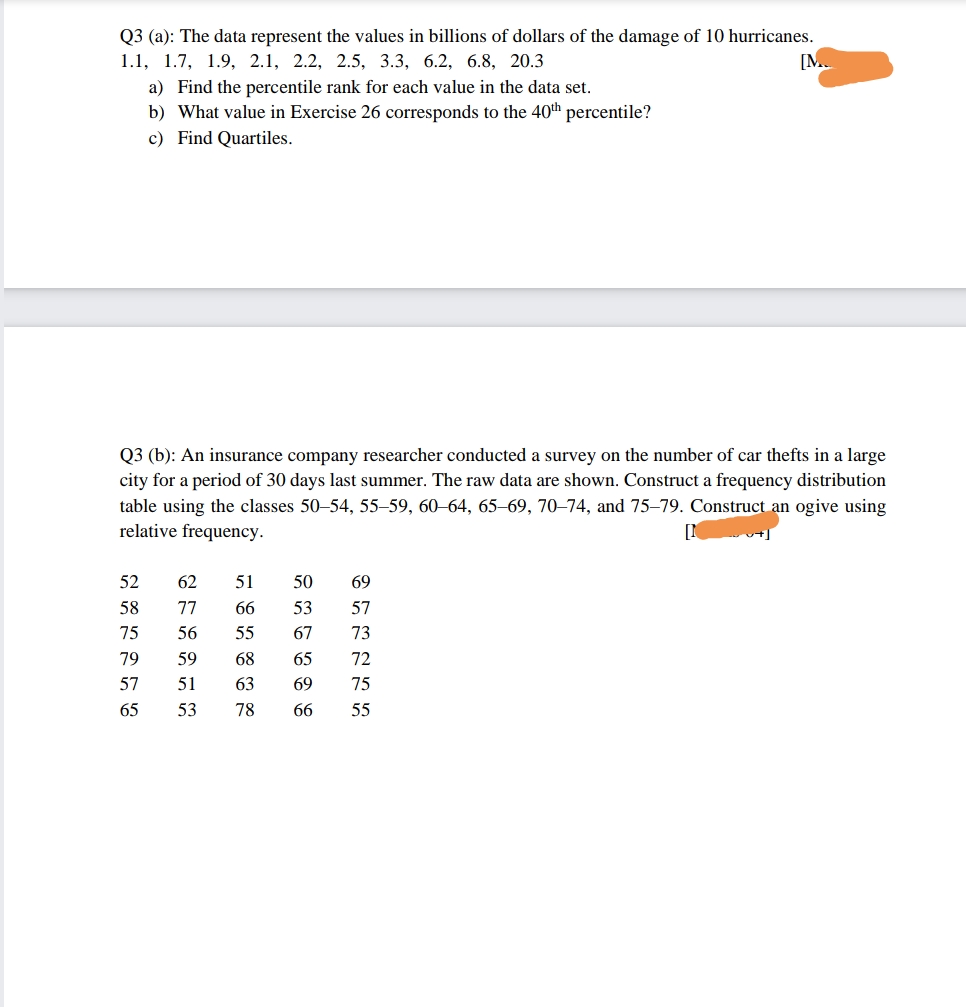
image text in transcribed
Q3 (a): The data represent the values in billions of dollars of the damage of 10 hurricanes. 1.1, 1.7, 1.9, 2.1, 2.2, 2.5, 3.3, 6.2, 6.8, 20.3 a) Find the percentile rank for each value in the data set. b) What value in Exercise 26 corresponds to the 40* percentile? c) Find Quartiles. a, Q3 (b): An insurance company researcher conducted a survey on the number of car thefts in a large city for a period of 30 days last summer. The raw data are shown. Construct a frequency distribution table using the classes 5054, 5559, 6064, 6569, TED74, and 7579. relative frequency. 52 58 75 79 57 65 62 77 56 59 51 53 51 66 55 63 63 TB 50 53 67 65 69 66 69 57 1'3 T2 T5 55 CDnstruc ogive using [d1]

Step by Step Solution

There are 3 Steps involved in it

Step: 1

blur-text-image

Get Instant Access to Expert-Tailored Solutions

See step-by-step solutions with expert insights and AI powered tools for academic success

Step: 2

blur-text-image

Step: 3

blur-text-image

Ace Your Homework with AI

Get the answers you need in no time with our AI-driven, step-by-step assistance

Get Started

Recommended Textbook for

Algebra And Trigonometry, Enhanced

Authors: Cynthia Y Young

4th Edition

1119320860, 9781119320869

More Books

Students also viewed these Mathematics questions

Question

Define the following terms within the context of this case:

Answered: 1 week ago

Question

Discuss the goals of financial management.

Answered: 1 week ago

Question

f. Did they change their names? For what reasons?

Answered: 1 week ago