Please solve it completely. I need it 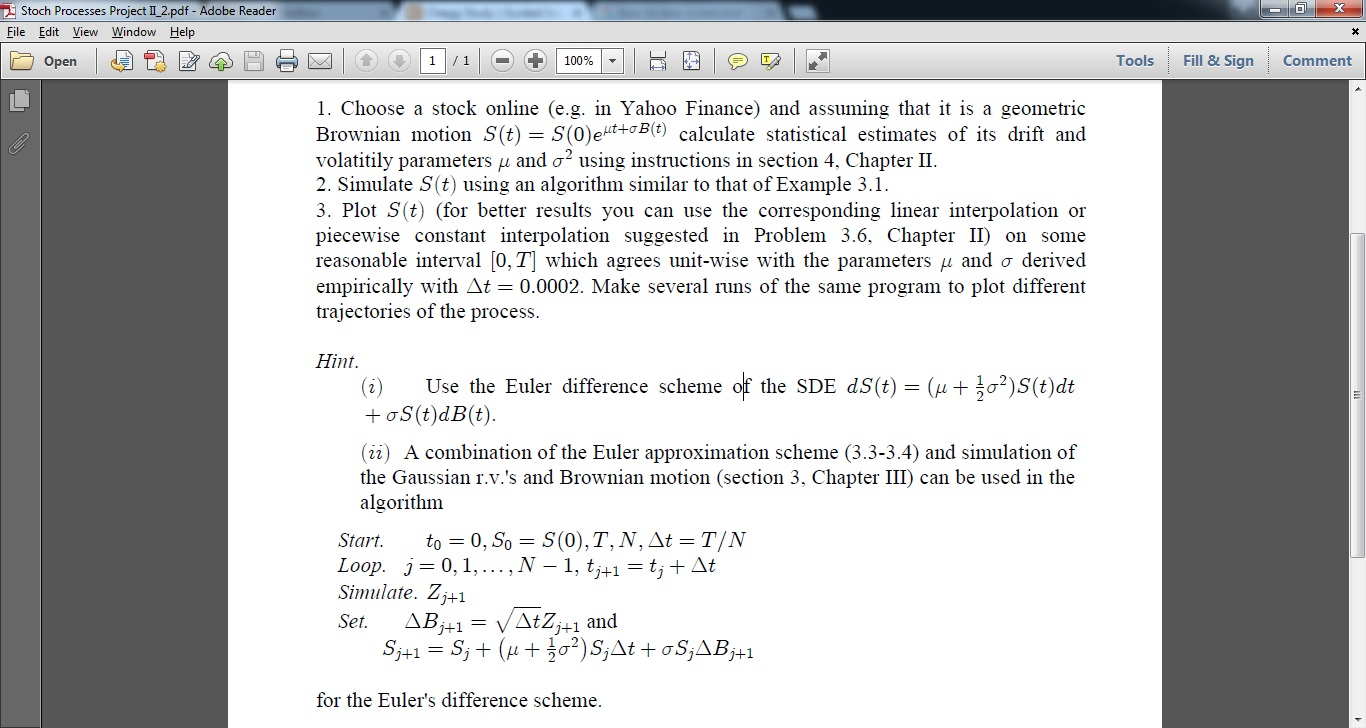
Choose a stock online (e.g. in Yahoo Finance) and assuming that it is a geometric Brownian motion S(t) = S(0) e^mu t + sigma B(t) calculate statistical estimates of its drift and volatility parameters mu and sigma^2 using instructions in section 4. Chapter II. Simulate S(t) using an algorithm similar to that of Example 3.1. Plot S(t) (for better results you can use the corresponding linear interpolation or piecewise constant interpolation suggested in Problem 3.6. Chapter II) on some reasonable interval [0, T] which agrees unit-wise with the parameters mu and sigma derived empirically with delta t = 0.0002. Make several runs of the same program to plot different trajectories of the process. Use the Euler difference scheme of the SDE dS(t) = (mu + 1/2 sigma^2)S(t)dt + sigma S(t)dB(t). A combination of the Euler approximation scheme (3.3-3.4) and simulation of the Gaussian r.v.'s and Brownian motion (section 3. Chapter III) can be used in the algorithm Start. t_0 = 0, S_0 = 5(0), T, N, delta t = T/N Loop, j = 0, 1,..., N - 1, t_j + 1 = t_j + delta f Simulate. Z_j + 1 Set. delta B_j + i = Squareroot delta t Z_j + 1 and S_j + 1 = S_j + (mu + 1/2 sigma^2) S_j delta t + sigma S_j delta B_j + 1 for the Euler's difference scheme. Choose a stock online (e.g. in Yahoo Finance) and assuming that it is a geometric Brownian motion S(t) = S(0) e^mu t + sigma B(t) calculate statistical estimates of its drift and volatility parameters mu and sigma^2 using instructions in section 4. Chapter II. Simulate S(t) using an algorithm similar to that of Example 3.1. Plot S(t) (for better results you can use the corresponding linear interpolation or piecewise constant interpolation suggested in Problem 3.6. Chapter II) on some reasonable interval [0, T] which agrees unit-wise with the parameters mu and sigma derived empirically with delta t = 0.0002. Make several runs of the same program to plot different trajectories of the process. Use the Euler difference scheme of the SDE dS(t) = (mu + 1/2 sigma^2)S(t)dt + sigma S(t)dB(t). A combination of the Euler approximation scheme (3.3-3.4) and simulation of the Gaussian r.v.'s and Brownian motion (section 3. Chapter III) can be used in the algorithm Start. t_0 = 0, S_0 = 5(0), T, N, delta t = T/N Loop, j = 0, 1,..., N - 1, t_j + 1 = t_j + delta f Simulate. Z_j + 1 Set. delta B_j + i = Squareroot delta t Z_j + 1 and S_j + 1 = S_j + (mu + 1/2 sigma^2) S_j delta t + sigma S_j delta B_j + 1 for the Euler's difference scheme