

Answered step by step
Verified Expert Solution
Question
1 Approved Answer
please solve it fast and correctly. I only have 15mins. pleasee Develop appropriate control charts and determine whether there is any cause for concern in
please solve it fast and correctly. I only have 15mins. pleasee
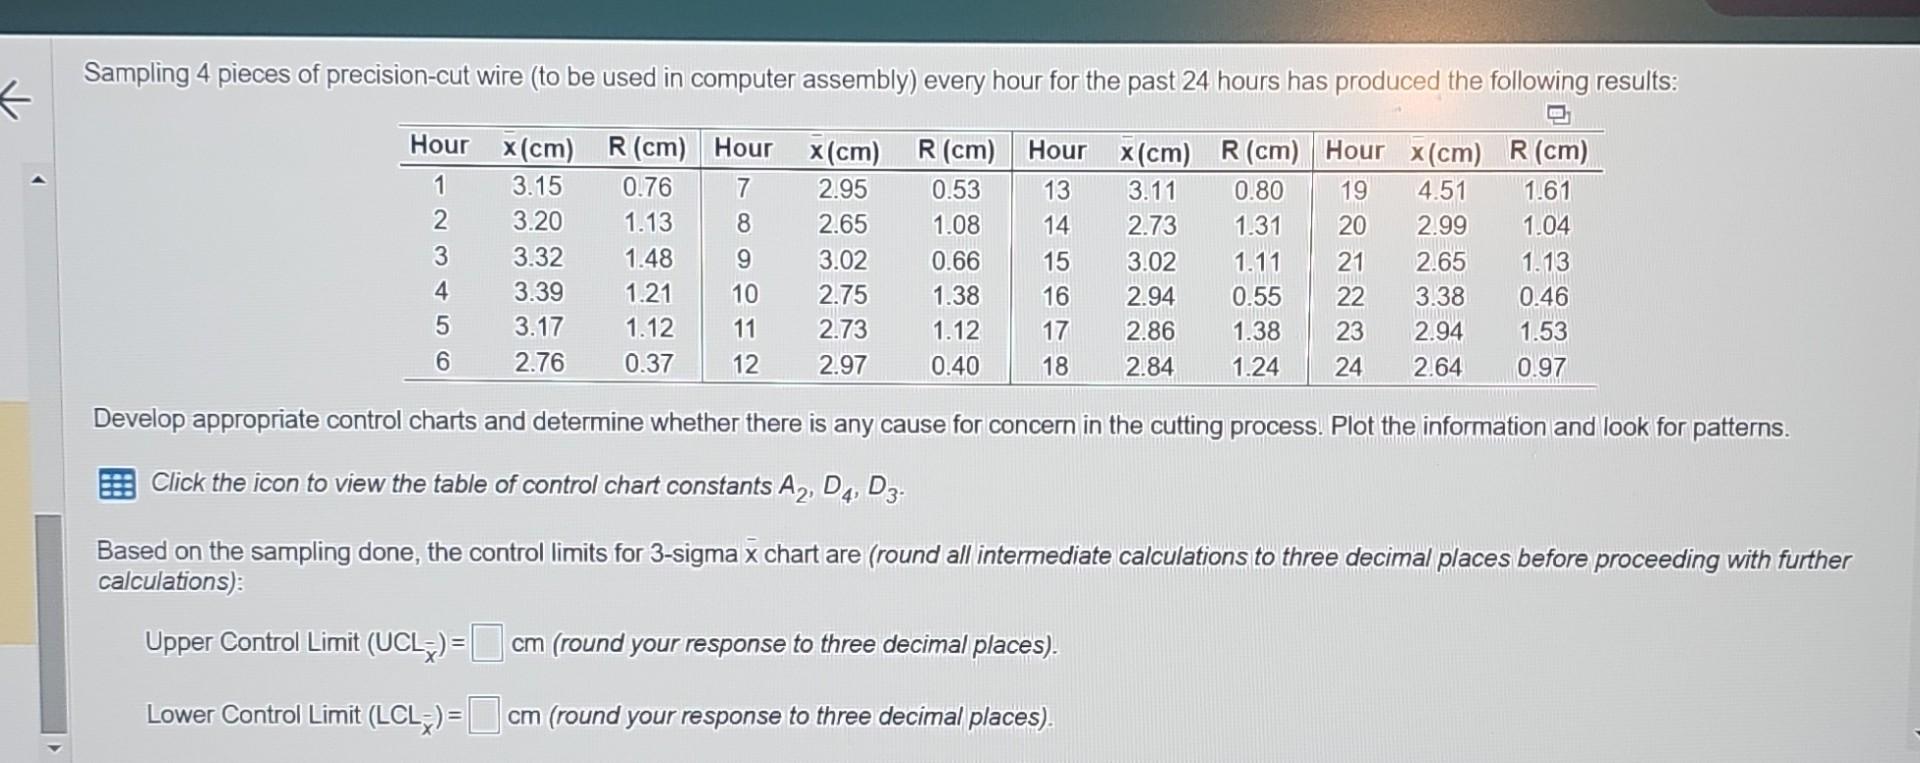
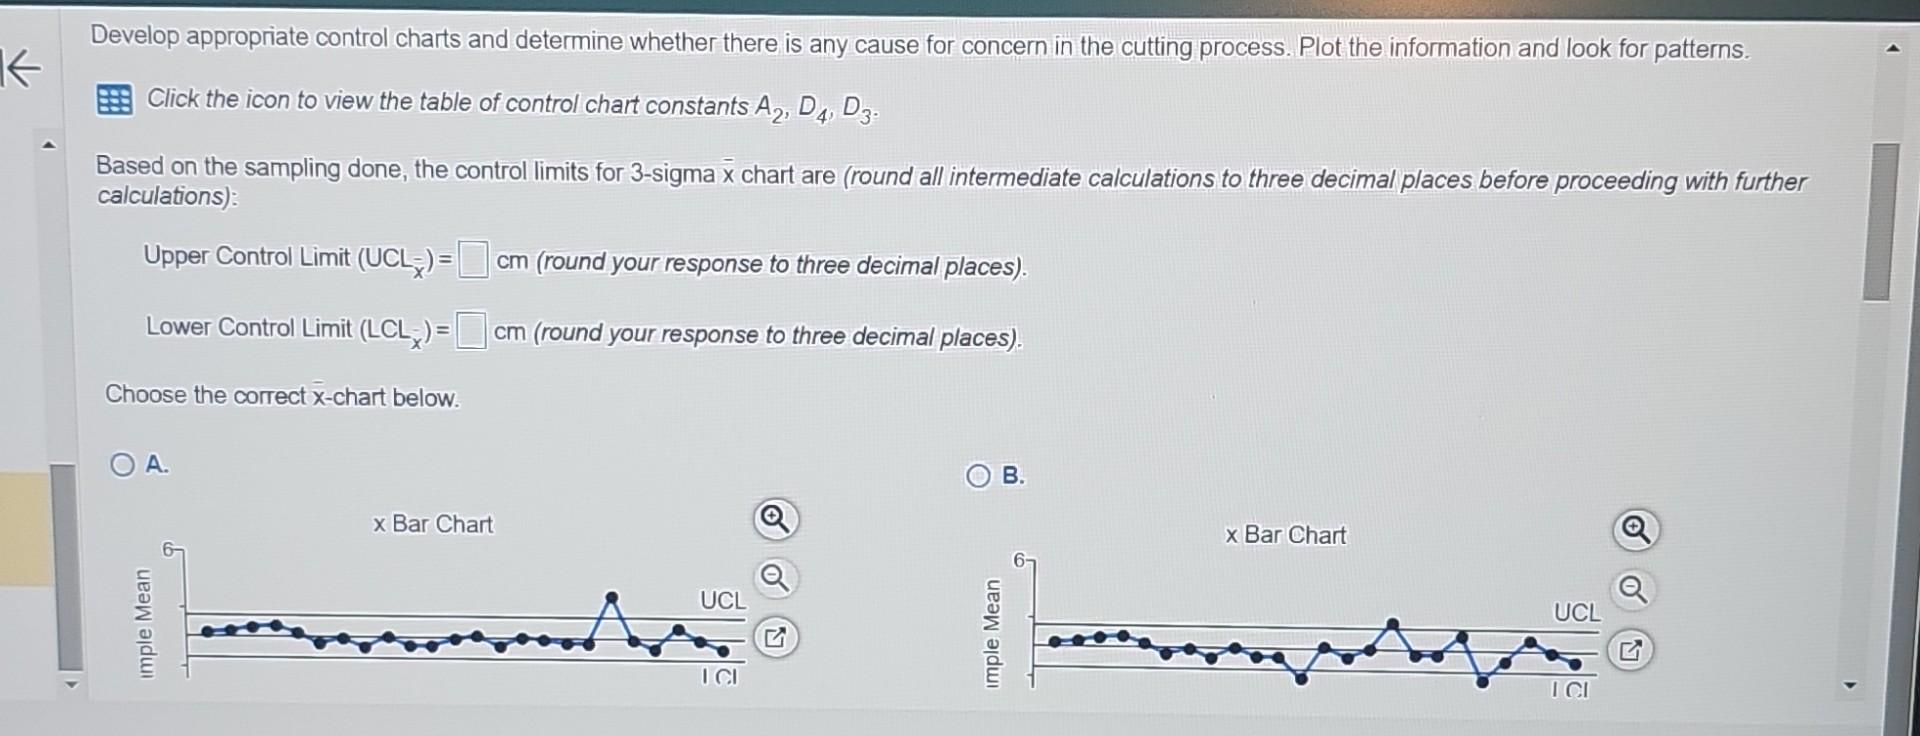
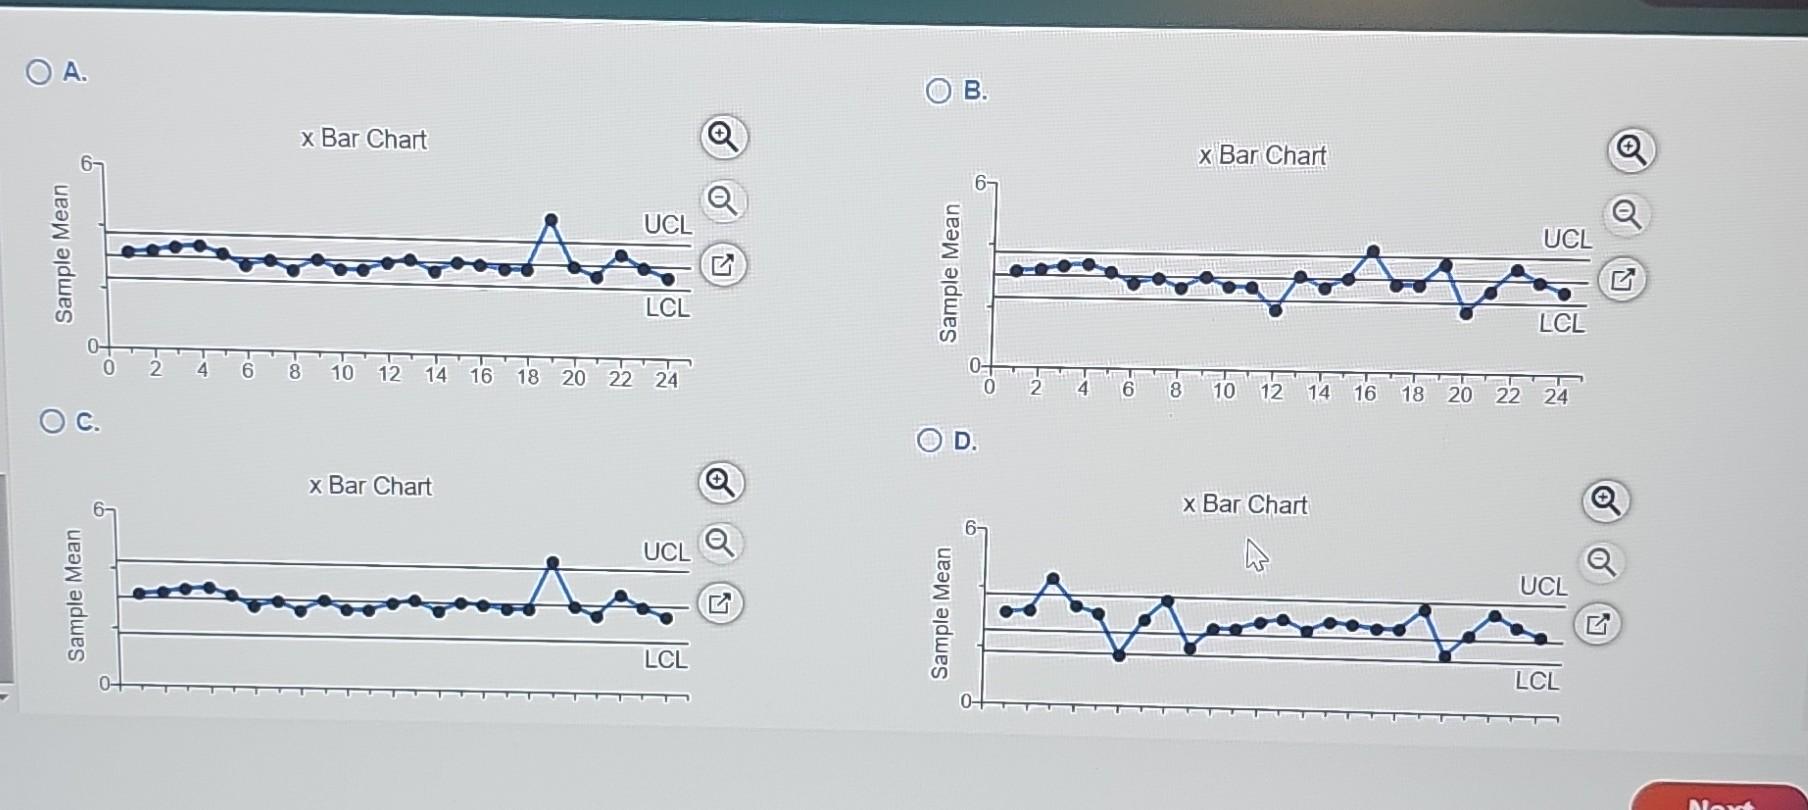
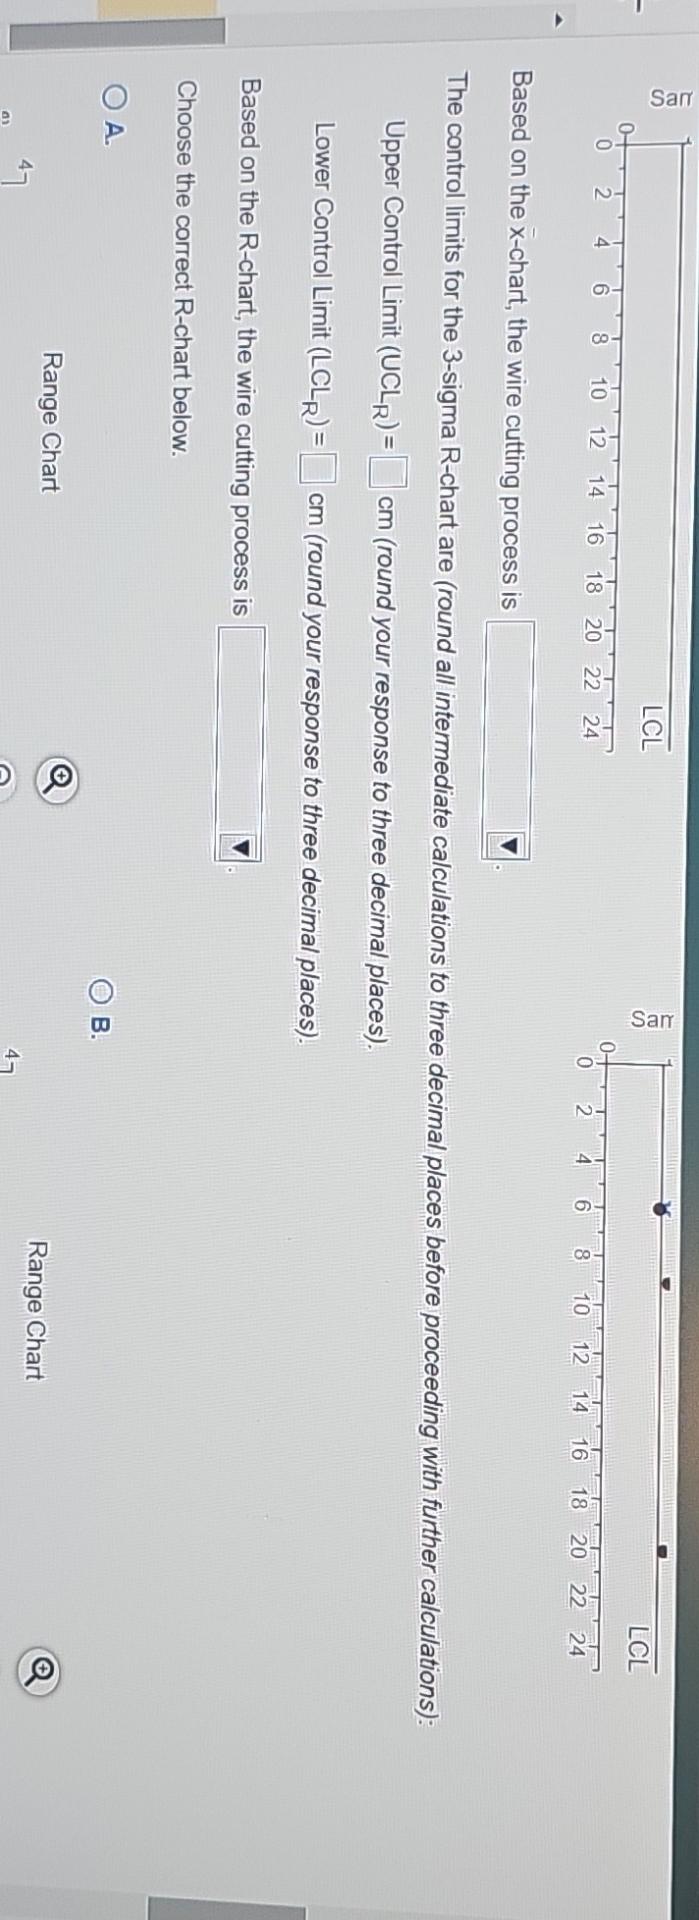
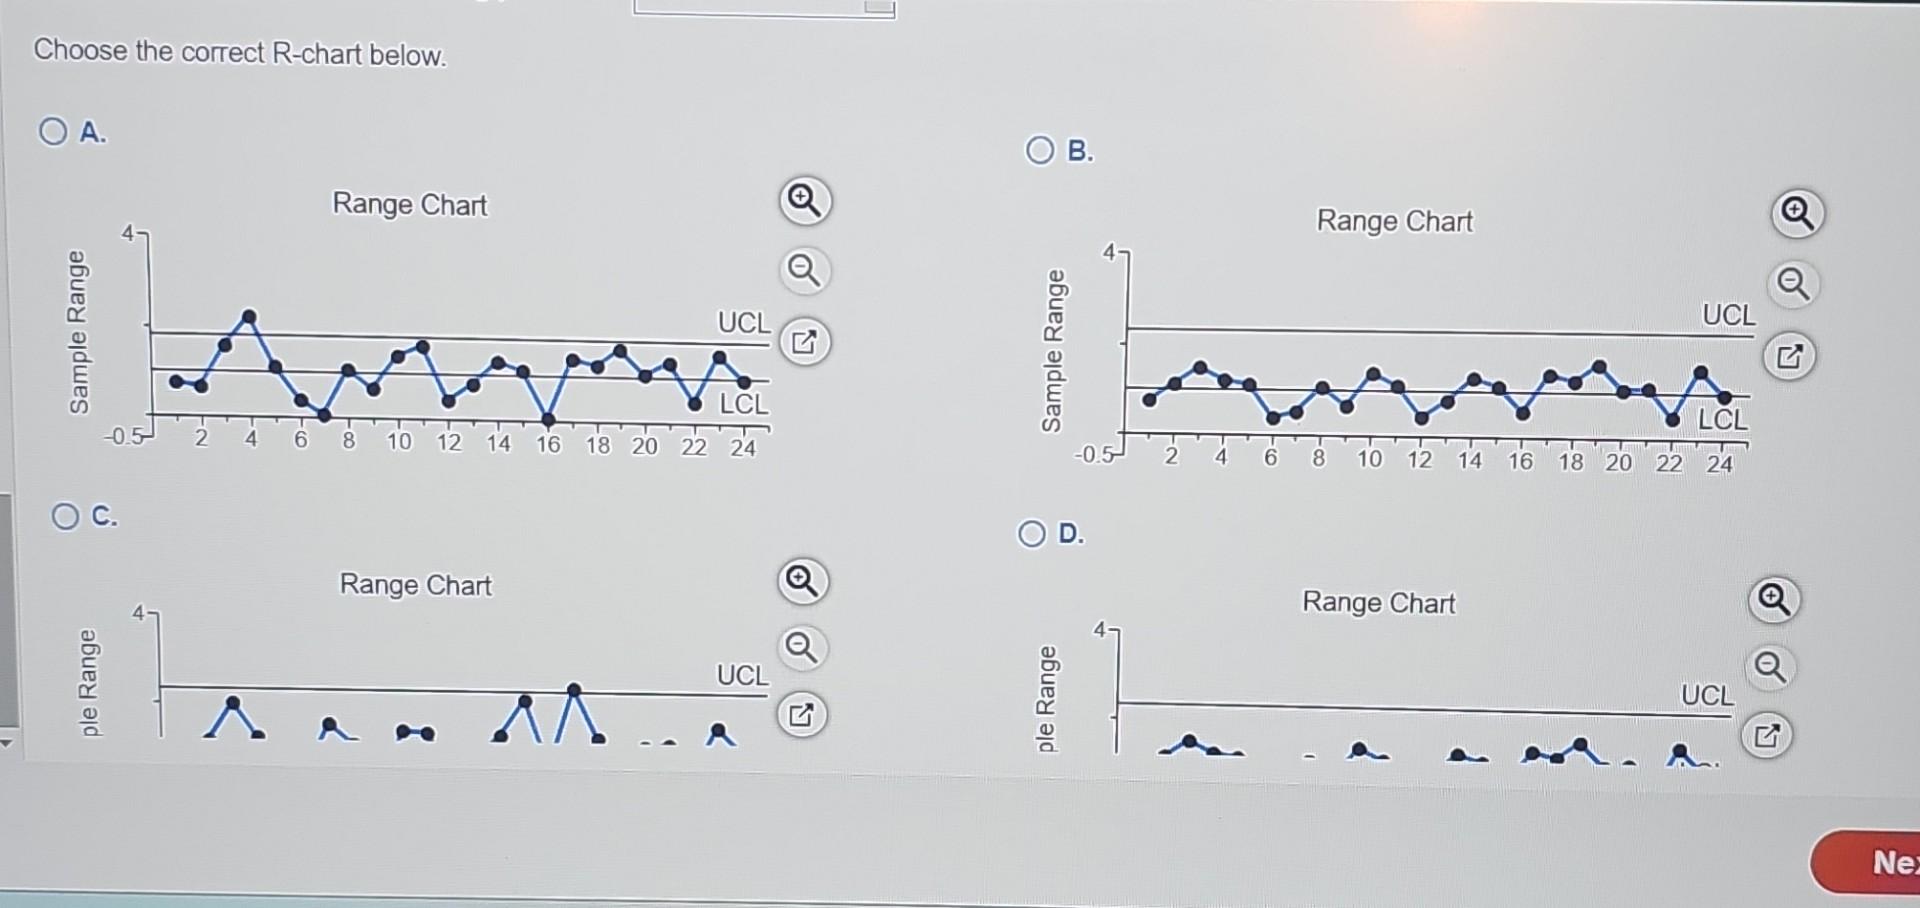
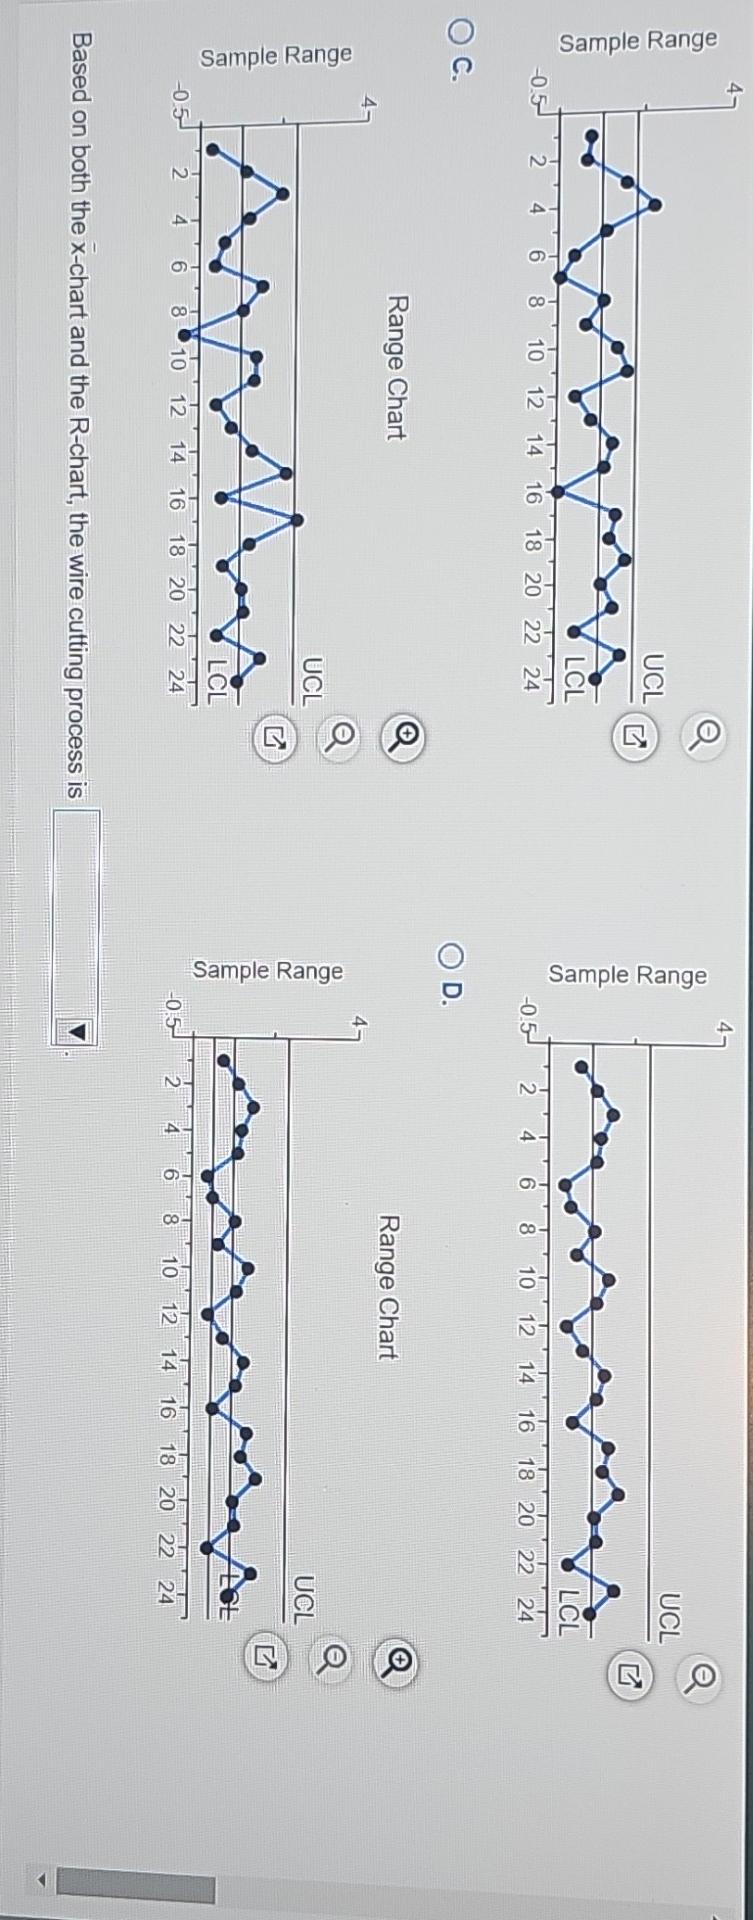
Develop appropriate control charts and determine whether there is any cause for concern in the cutting process. Plot the information and look for patterns. Click the icon to view the table of control chart constants A2,D4,D3. Based on the sampling done, the control limits for 3-sigma x chart are (round all intermediate calculations to three decimal places before proceeding with further calculations): Upper Control Limit (UCL)=cm (round your response to three decimal places). Lower Control Limit (LCLx)=cm (round your response to three decimal places). Develop appropriate control charts and determine whether there is any cause for concern in the cutting process. Plot the information and look for patterns. Click the icon to view the table of control chart constants A2,D4,D3. Based on the sampling done, the control limits for 3 -sigma x chart are (round all intermediate calculations to three decimal places before proceeding with further calculations): Upper Control Limit (UCL)=cm (round your response to three decimal places). Lower Control Limit (LCL)=cm (round your response to three decimal places). A. x Bar Chart c. x Bar Chart B. x Bar Chart D. Based on the x-chart, the wire cutting process is The control limits for the 3-sigma R-chart are (round all intermediate calculations to three decimal places before proceeding with further calculations): Upper Control Limit (UCLR)=cm (round your response to three decimal places). Lower Control Limit (LCLR)=cm (round your response to three decimal places). Based on the R-chart, the wire cutting process is Choose the correct R-chart below. A. B. Range Chart Choose the correct R-chart below. A. Based on both the x-chart and the R-chart, the wire cutting process is Develop appropriate control charts and determine whether there is any cause for concern in the cutting process. Plot the information and look for patterns. Click the icon to view the table of control chart constants A2,D4,D3. Based on the sampling done, the control limits for 3-sigma x chart are (round all intermediate calculations to three decimal places before proceeding with further calculations): Upper Control Limit (UCL)=cm (round your response to three decimal places). Lower Control Limit (LCLx)=cm (round your response to three decimal places). Develop appropriate control charts and determine whether there is any cause for concern in the cutting process. Plot the information and look for patterns. Click the icon to view the table of control chart constants A2,D4,D3. Based on the sampling done, the control limits for 3 -sigma x chart are (round all intermediate calculations to three decimal places before proceeding with further calculations): Upper Control Limit (UCL)=cm (round your response to three decimal places). Lower Control Limit (LCL)=cm (round your response to three decimal places). A. x Bar Chart c. x Bar Chart B. x Bar Chart D. Based on the x-chart, the wire cutting process is The control limits for the 3-sigma R-chart are (round all intermediate calculations to three decimal places before proceeding with further calculations): Upper Control Limit (UCLR)=cm (round your response to three decimal places). Lower Control Limit (LCLR)=cm (round your response to three decimal places). Based on the R-chart, the wire cutting process is Choose the correct R-chart below. A. B. Range Chart Choose the correct R-chart below. A. Based on both the x-chart and the R-chart, the wire cutting process isStep by Step Solution
There are 3 Steps involved in it
Step: 1

Get Instant Access to Expert-Tailored Solutions
See step-by-step solutions with expert insights and AI powered tools for academic success
Step: 2

Step: 3
Ace Your Homework with AI
Get the answers you need in no time with our AI-driven, step-by-step assistance
Get Started
The Pain Management Workbook
Authors: Rachel Zoffness, Mark A. Schumacher
1st Edition
1684036445, 978-1684036448