 Please solve only four points using MATLAB mentioned in image 1. Remaining is just description and code for help
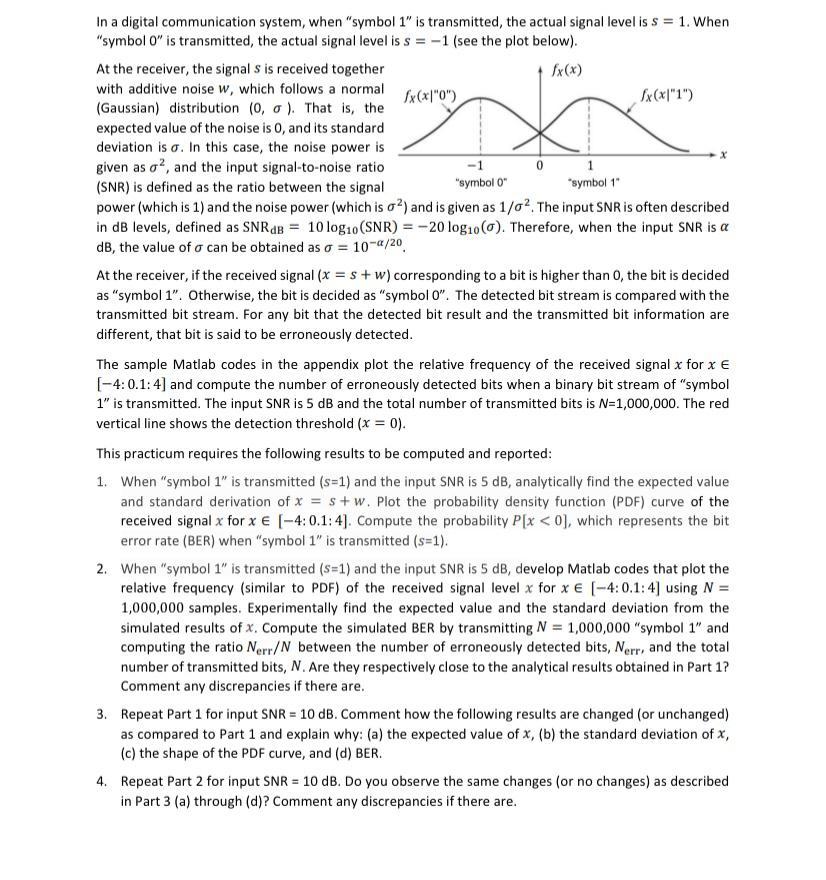
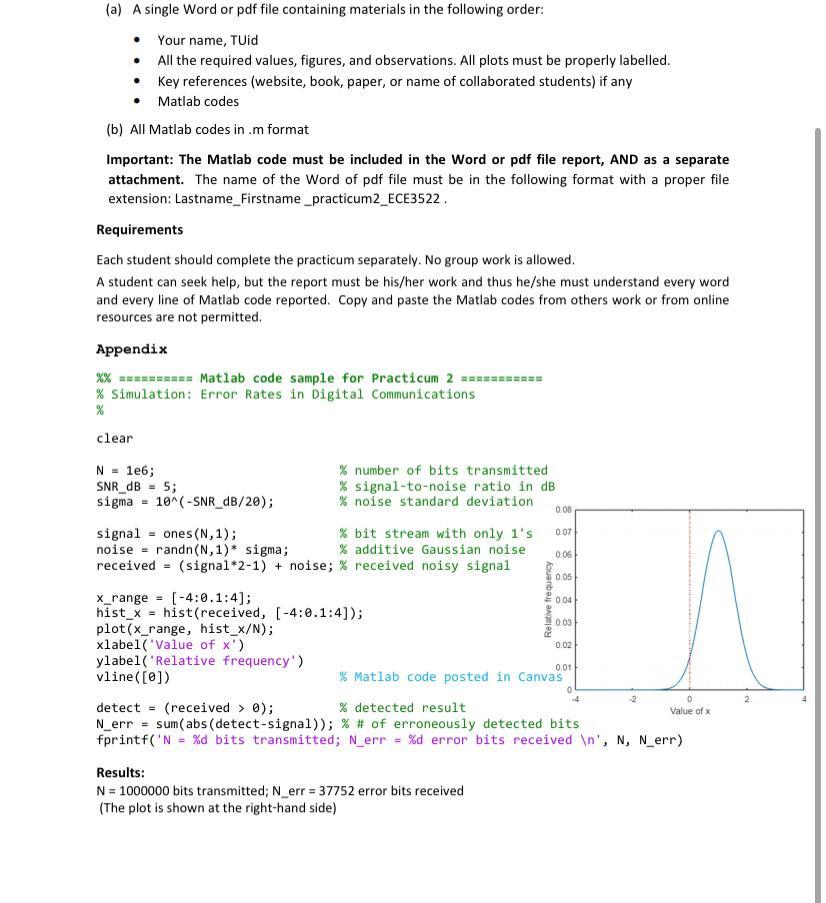
In a digital communication system, when "symbol 1" is transmitted, the actual signal level is s = 1. When "symbol o" is transmitted, the actual signal level is s = -1 (see the plot below). At the receiver, the signals is received together fx(x) with additive noise w, which follows a normal 1x(x|"0") x(x|"1") (Gaussian) distribution (0, 0 ). That is, the expected value of the noise is 0, and its standard deviation is o. In this case, the noise power is given as o?, and the input signal-to-noise ratio 0 (SNR) is defined as the ratio between the signal "symbolo" symbol 1" power (which is 1) and the noise power (which is o) and is given as 1/02. The input SNR is often described in dB levels, defined as SNR dB = 10 log10 (SNR) = -20 log10 (6). Therefore, when the input SNR is a dB, the value of a can be obtained as a = 10-a/20 At the receiver, if the received signal (x = s +w) corresponding to a bit is higher than 0, the bit is decided as "symbol 1". Otherwise, the bit is decided as "symbol O". The detected bit stream is compared with the transmitted bit stream. For any bit that the detected bit result and the transmitted bit information are different that bit is said to be erroneously detected. The sample Matlab codes in the appendix plot the relative frequency of the received signal x for x (-4:0.1: 4) and compute the number of erroneously detected bits when a binary bit stream of "symbol 1" is transmitted. The input SNR is 5 dB and the total number of transmitted bits is N=1,000,000. The red vertical line shows the detection threshold (x = 0). This practicum requires the following results to be computed and reported: 1. When "symbol 1" is transmitted (s=1) and the input SNR is 5 dB, analytically find the expected value and standard derivation of x = s+w. Plot the probability density function (PDF) curve of the received signal x for x (-4:0.1:4). Compute the probability P[x 0); % detected result Value of N_err = sum(abs (detect-signal)); % # of erroneously detected bits fprintf('N = %d bits transmitted; N_err = %d error bits received ', N, N_err) 0.01 2 Results: N = 1000000 bits transmitted; N_err = 37752 error bits received (The plot is shown at the right-hand side) In a digital communication system, when "symbol 1" is transmitted, the actual signal level is s = 1. When "symbol o" is transmitted, the actual signal level is s = -1 (see the plot below). At the receiver, the signals is received together fx(x) with additive noise w, which follows a normal 1x(x|"0") x(x|"1") (Gaussian) distribution (0, 0 ). That is, the expected value of the noise is 0, and its standard deviation is o. In this case, the noise power is given as o?, and the input signal-to-noise ratio 0 (SNR) is defined as the ratio between the signal "symbolo" symbol 1" power (which is 1) and the noise power (which is o) and is given as 1/02. The input SNR is often described in dB levels, defined as SNR dB = 10 log10 (SNR) = -20 log10 (6). Therefore, when the input SNR is a dB, the value of a can be obtained as a = 10-a/20 At the receiver, if the received signal (x = s +w) corresponding to a bit is higher than 0, the bit is decided as "symbol 1". Otherwise, the bit is decided as "symbol O". The detected bit stream is compared with the transmitted bit stream. For any bit that the detected bit result and the transmitted bit information are different that bit is said to be erroneously detected. The sample Matlab codes in the appendix plot the relative frequency of the received signal x for x (-4:0.1: 4) and compute the number of erroneously detected bits when a binary bit stream of "symbol 1" is transmitted. The input SNR is 5 dB and the total number of transmitted bits is N=1,000,000. The red vertical line shows the detection threshold (x = 0). This practicum requires the following results to be computed and reported: 1. When "symbol 1" is transmitted (s=1) and the input SNR is 5 dB, analytically find the expected value and standard derivation of x = s+w. Plot the probability density function (PDF) curve of the received signal x for x (-4:0.1:4). Compute the probability P[x 0); % detected result Value of N_err = sum(abs (detect-signal)); % # of erroneously detected bits fprintf('N = %d bits transmitted; N_err = %d error bits received ', N, N_err) 0.01 2 Results: N = 1000000 bits transmitted; N_err = 37752 error bits received (The plot is shown at the right-hand side)