

Answered step by step
Verified Expert Solution
Question
1 Approved Answer
Please solve step by step In this part you are asked to perform an empirical analysis on the the connection between work and sleep. It
Please solve step by step 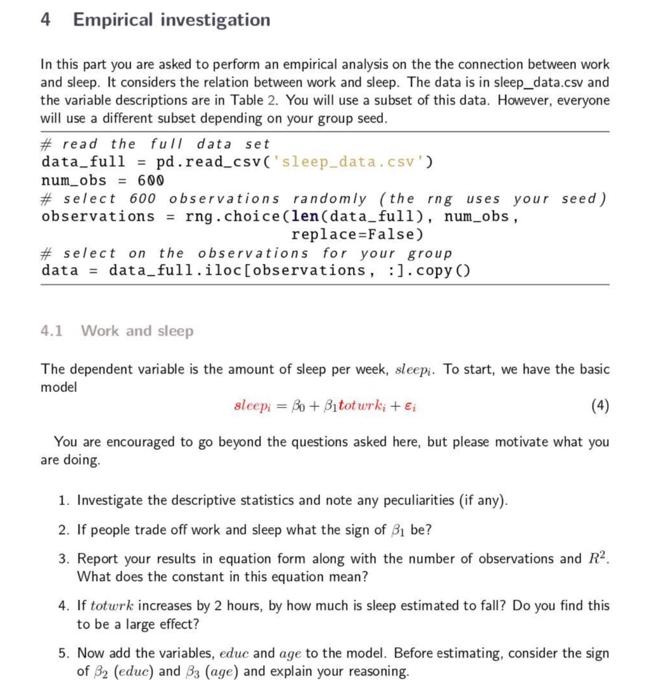
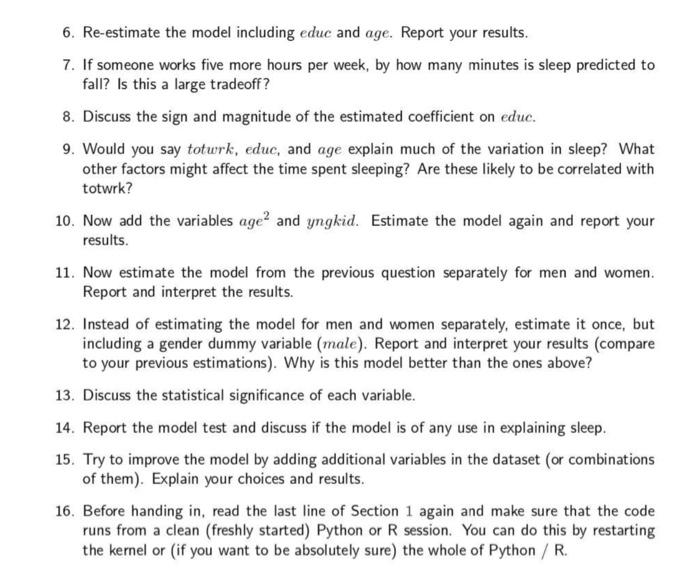
In this part you are asked to perform an empirical analysis on the the connection between work and sleep. It considers the relation between work and sleep. The data is in sleep_data.csv and the variable descriptions are in Table 2. You will use a subset of this data. However, everyone will use a different subset depending on your group seed. \# read the full data set data_full = pd.read_csv('sleep_data.csv') num_obs =600 \# select 600 observations randomly (the rng uses your seed) observations = rng.choice(len(data_full), num_obs, replace = False ) \# select on the observations for your group data = data_full.iloc[observations, : ]. copy() 4.1 Work and sleep The dependent variable is the amount of sleep per week, sleep pi. To start, we have the basic model slcepi=0+1toturki+i You are encouraged to go beyond the questions asked here, but please motivate what you are doing. 1. Investigate the descriptive statistics and note any peculiarities (if any). 2. If people trade off work and sleep what the sign of 1 be? 3. Report your results in equation form along with the number of observations and R2. What does the constant in this equation mean? 4. If totwrk increases by 2 hours, by how much is sleep estimated to fall? Do you find this to be a large effect? 5. Now add the variables, educ and age to the model. Before estimating, consider the sign of 2(educ) and 3(age) and explain your reasoning. 6. Re-estimate the model including educ and age. Report your results. 7. If someone works five more hours per week, by how many minutes is sleep predicted to fall? Is this a large tradeoff? 8. Discuss the sign and magnitude of the estimated coefficient on educ. 9. Would you say totwrk, educ, and age explain much of the variation in sleep? What other factors might affect the time spent sleeping? Are these likely to be correlated with totwrk? 10. Now add the variables a2e2 and yngkid. Estimate the model again and report your results. 11. Now estimate the model from the previous question separately for men and women. Report and interpret the results. 12. Instead of estimating the model for men and women separately, estimate it once, but including a gender dummy variable (male). Report and interpret your results (compare to your previous estimations). Why is this model better than the ones above? 13. Discuss the statistical significance of each variable. 14. Report the model test and discuss if the model is of any use in explaining sleep. 15. Try to improve the model by adding additional variables in the dataset (or combinations of them). Explain your choices and results. 16. Before handing in, read the last line of Section 1 again and make sure that the code runs from a clean (freshly started) Python or R session. You can do this by restarting the kernel or (if you want to be absolutely sure) the whole of Python / R Step by Step Solution
There are 3 Steps involved in it
Step: 1

Get Instant Access to Expert-Tailored Solutions
See step-by-step solutions with expert insights and AI powered tools for academic success
Step: 2

Step: 3
Ace Your Homework with AI
Get the answers you need in no time with our AI-driven, step-by-step assistance
Get Started
Current Trends In Database Technology Edbt 2004 Workshops Edbt 2004 Workshops Phd Datax Pim P2panddb And Clustweb Heraklion Crete Greece March 2004 Revised Selected Papers Lncs 3268
Authors: Wolfgang Lindner ,Marco Mesiti ,Can Turker ,Yannis Tzitzikas ,Athena Vakali
2005th Edition
3540233059, 978-3540233053