******PLEASE SOLVE THE PROBLEM USING EXCEL SHOWING ALL YOUR WORK/FORMULAS YOU USED IN EACH NUMBER FOUND********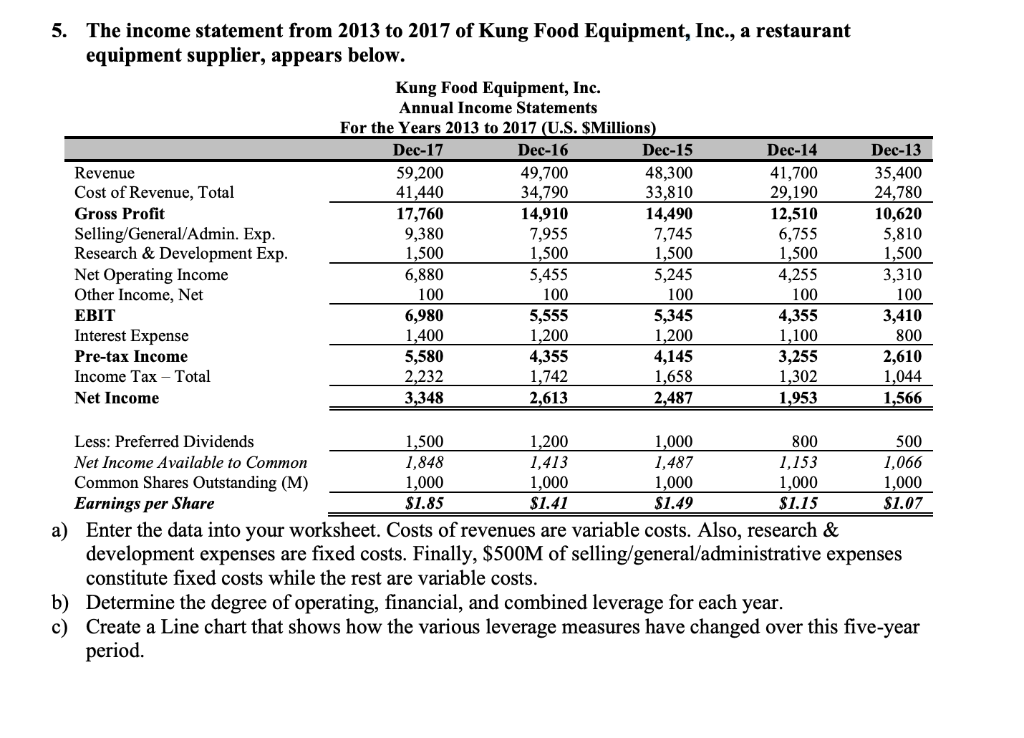
5. The income statement from 2013 to 2017 of Kung Food Equipment, Inc., a restaurant equipment supplier, appears below. Kung Food Equipment, Inc. Annual Income Statements For the Years 2013 to 2017 (U.S. $Millions) Dec-17 Dec-16 Dec-15 Dec-14 Revenue 59,200 49,700 48,300 41,700 Cost of Revenue, Total 41,440 34,790 33,810 29,190 Gross Profit 17,760 14,910 14,490 12,510 Selling/General/Admin. Exp. 9,380 7,955 7,745 6,755 Research & Development Exp. 1,500 1,500 1,500 1,500 Net Operating Income 6,880 5,455 5,245 4,255 Other Income, Net 100 100 100 100 EBIT 6,980 5,555 5,345 4,355 Interest Expense 1,400 1,200 1,200 1,100 Pre-tax Income 5,580 4,355 4,145 3,255 Income Tax - Total 2,232 1,742 1,658 1,302 Net Income 3,348 2,613 2,487 1,953 Dec-13 35,400 24,780 10,620 5,810 1,500 3,310 100 3,410 800 2,610 1,044 1,566 Less: Preferred Dividends 1,500 1,200 1,000 800 500 Income Available Common 1,84 1,487 1,15 1,066 Common Shares Outstanding (M) 1,000 1,000 1,000 1,000 1,000 Earnings per Share $1.85 $1.41 $1.49 $1.15 $1.07 a) Enter the data into your worksheet. Costs of revenues are variable costs. Also, research & development expenses are fixed costs. Finally, $500M of selling/general/administrative expenses constitute fixed costs while the rest are variable costs. b) Determine the degree of operating, financial, and combined leverage for each year. c) Create a Line chart that shows how the various leverage measures have changed over this five-year period. 5. The income statement from 2013 to 2017 of Kung Food Equipment, Inc., a restaurant equipment supplier, appears below. Kung Food Equipment, Inc. Annual Income Statements For the Years 2013 to 2017 (U.S. $Millions) Dec-17 Dec-16 Dec-15 Dec-14 Revenue 59,200 49,700 48,300 41,700 Cost of Revenue, Total 41,440 34,790 33,810 29,190 Gross Profit 17,760 14,910 14,490 12,510 Selling/General/Admin. Exp. 9,380 7,955 7,745 6,755 Research & Development Exp. 1,500 1,500 1,500 1,500 Net Operating Income 6,880 5,455 5,245 4,255 Other Income, Net 100 100 100 100 EBIT 6,980 5,555 5,345 4,355 Interest Expense 1,400 1,200 1,200 1,100 Pre-tax Income 5,580 4,355 4,145 3,255 Income Tax - Total 2,232 1,742 1,658 1,302 Net Income 3,348 2,613 2,487 1,953 Dec-13 35,400 24,780 10,620 5,810 1,500 3,310 100 3,410 800 2,610 1,044 1,566 Less: Preferred Dividends 1,500 1,200 1,000 800 500 Income Available Common 1,84 1,487 1,15 1,066 Common Shares Outstanding (M) 1,000 1,000 1,000 1,000 1,000 Earnings per Share $1.85 $1.41 $1.49 $1.15 $1.07 a) Enter the data into your worksheet. Costs of revenues are variable costs. Also, research & development expenses are fixed costs. Finally, $500M of selling/general/administrative expenses constitute fixed costs while the rest are variable costs. b) Determine the degree of operating, financial, and combined leverage for each year. c) Create a Line chart that shows how the various leverage measures have changed over this five-year period