Answered step by step
Verified Expert Solution
Question
1 Approved Answer
PLEASE SOLVE THE QUESTION USING EXCEL ONLY!!! SHOW ALL FOMRULAS USED IN EXCEL I 3% 6. The following table contains the probability distribution for the
PLEASE SOLVE THE QUESTION USING EXCEL ONLY!!! SHOW ALL FOMRULAS USED IN EXCEL
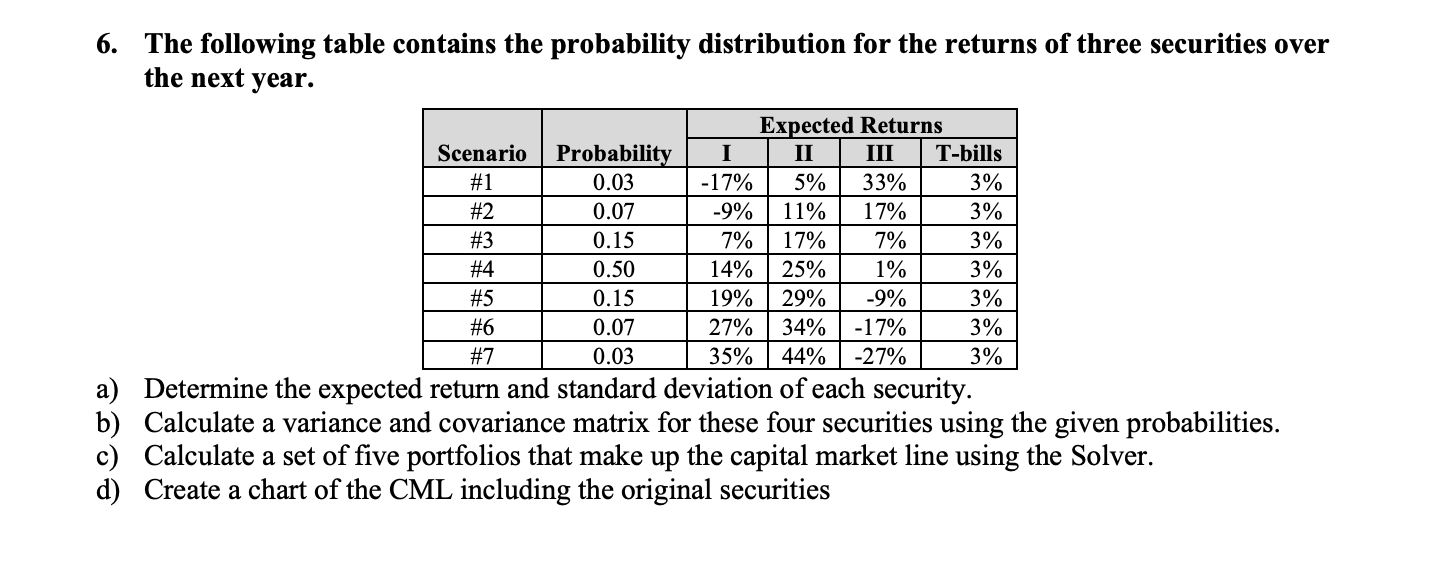
I 3% 6. The following table contains the probability distribution for the returns of three securities over the next year. Expected Returns Scenario Probability II III T-bills #1 0.03 -17% 5% 33% 3% #2 0.07 -9% 11% 17% 3% #3 0.15 7% 17% 7% #4 0.50 14% 25% 1% 3% #5 0.15 19% 29% -9% 3% #6 0.07 27% 34% -17% 3% #7 0.03 35% 44% -27% 3% a) Determine the expected return and standard deviation of each security. b) Calculate a variance and covariance matrix for these four securities using the given probabilities. c) Calculate a set of five portfolios that make up the capital market line using the Solver. d) Create a chart of the CML including the original securities I 3% 6. The following table contains the probability distribution for the returns of three securities over the next year. Expected Returns Scenario Probability II III T-bills #1 0.03 -17% 5% 33% 3% #2 0.07 -9% 11% 17% 3% #3 0.15 7% 17% 7% #4 0.50 14% 25% 1% 3% #5 0.15 19% 29% -9% 3% #6 0.07 27% 34% -17% 3% #7 0.03 35% 44% -27% 3% a) Determine the expected return and standard deviation of each security. b) Calculate a variance and covariance matrix for these four securities using the given probabilities. c) Calculate a set of five portfolios that make up the capital market line using the Solver. d) Create a chart of the CML including the original securitiesStep by Step Solution
There are 3 Steps involved in it
Step: 1
Get Instant Access to Expert-Tailored Solutions
See step-by-step solutions with expert insights and AI powered tools for academic success
Step: 2
Step: 3
Ace Your Homework with AI
Get the answers you need in no time with our AI-driven, step-by-step assistance
Get Started