

Answered step by step
Verified Expert Solution
Question
1 Approved Answer
Please solve this in MATLAB and include comments and explanation. Thank you! 2) Consider the following input data: Table 1 DAT: Vis y-axis, SOC is
Please solve this in MATLAB and include comments and explanation. Thank you!
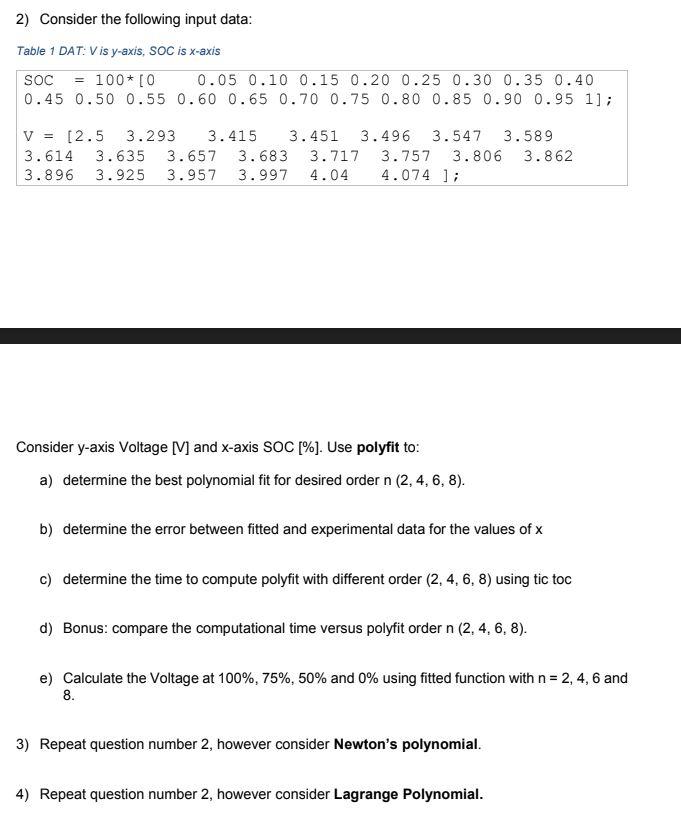
2) Consider the following input data: Table 1 DAT: Vis y-axis, SOC is x-axis SOC 100* [O 0.05 0.10 0.15 0.20 0.25 0.30 0.35 0.40 0.45 0.50 0.55 0.60 0.65 0.70 0.75 0.80 0.85 0.90 0.95 1]; V = [2.5 3.293 3.415 3.451 3.496 3.547 3.589 3.614 3.635 3.657 3.683 3.717 3.757 3.806 3.862 3.896 3.925 3.957 3.997 4.04 4.074 ] ; Consider y-axis Voltage M and X-axis SOC [%]. Use polyfit to: a) determine the best polynomial fit for desired order n (2, 4, 6, 8). b) determine the error between fitted and experimental data for the values of x c) determine the time to compute polyfit with different order (2, 4, 6, 8) using tic toc d) Bonus: compare the computational time versus polyfit order n (2, 4, 6, 8). e) Calculate the Voltage at 100%, 75%, 50% and 0% using fitted function with n=2, 4, 6 and 8. 3) Repeat question number 2, however consider Newton's polynomial. 4) Repeat question number 2, however consider Lagrange PolynomialStep by Step Solution
There are 3 Steps involved in it
Step: 1

Get Instant Access to Expert-Tailored Solutions
See step-by-step solutions with expert insights and AI powered tools for academic success
Step: 2

Step: 3
Ace Your Homework with AI
Get the answers you need in no time with our AI-driven, step-by-step assistance
Get Started
Performing With Computer Applications Personal Information Manager Word Processing Desktop Publishing Spreadsheets Databases Presentations Assessment Manager
Authors: Iris Blanc
3rd Edition
141886515X, 978-1418865153