Answered step by step
Verified Expert Solution
Link Copied!

Question

1 Approved Answer

Please solve using python and as soon as possible thank you! IMPORTANT: For the questions below do not use any loops. All data extraction can

Please solve using python and as soon as possible thank you!
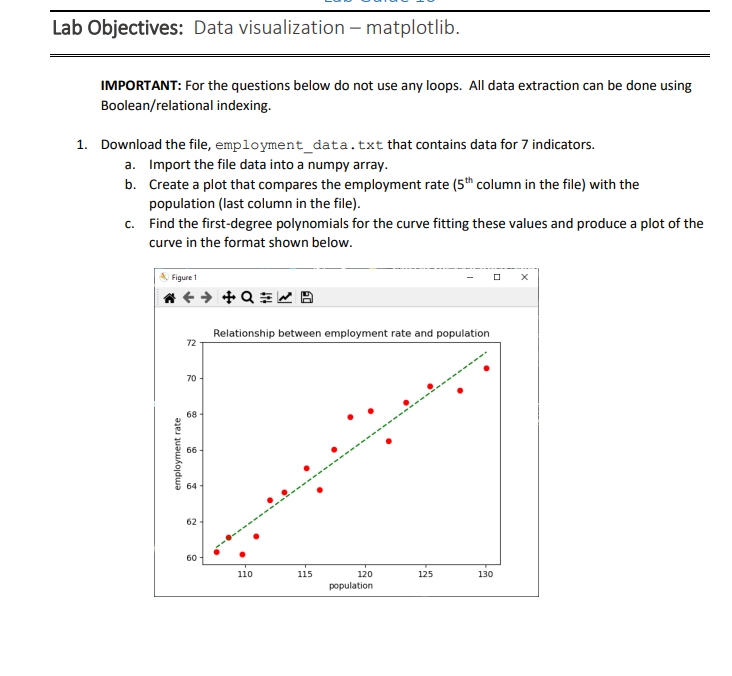
image text in transcribed

image text in transcribedimage text in transcribedimage text in transcribedimage text in transcribed

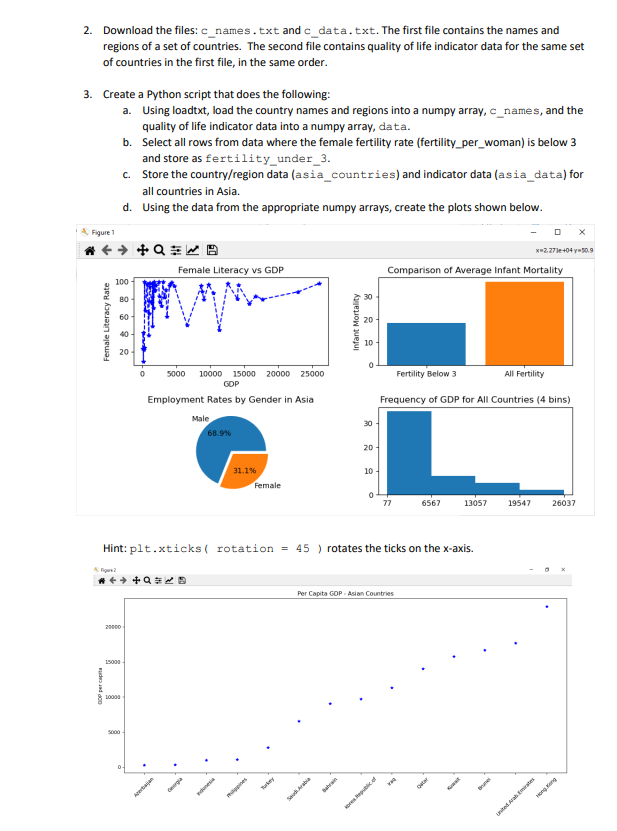
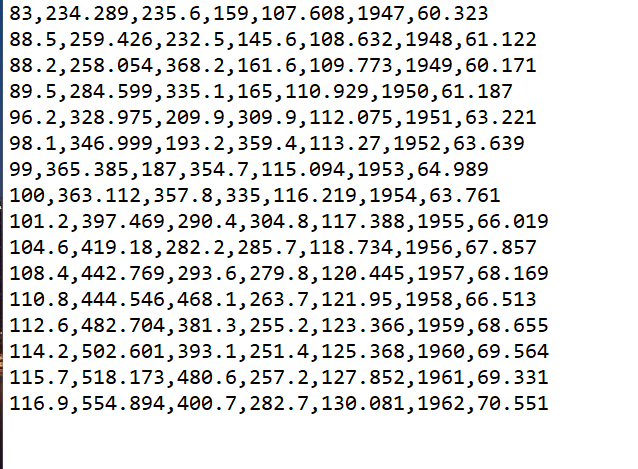
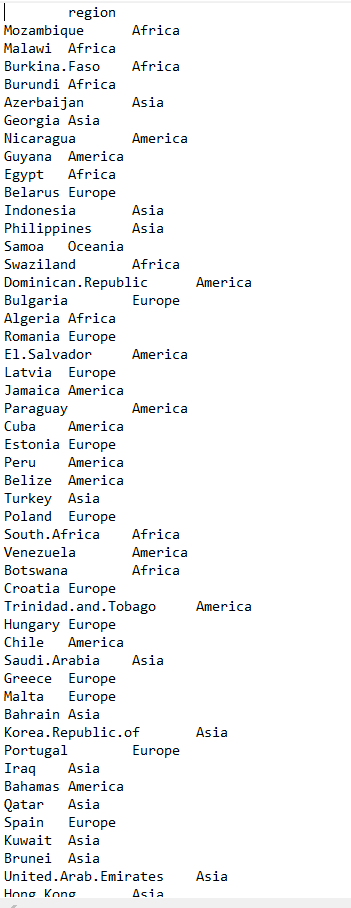
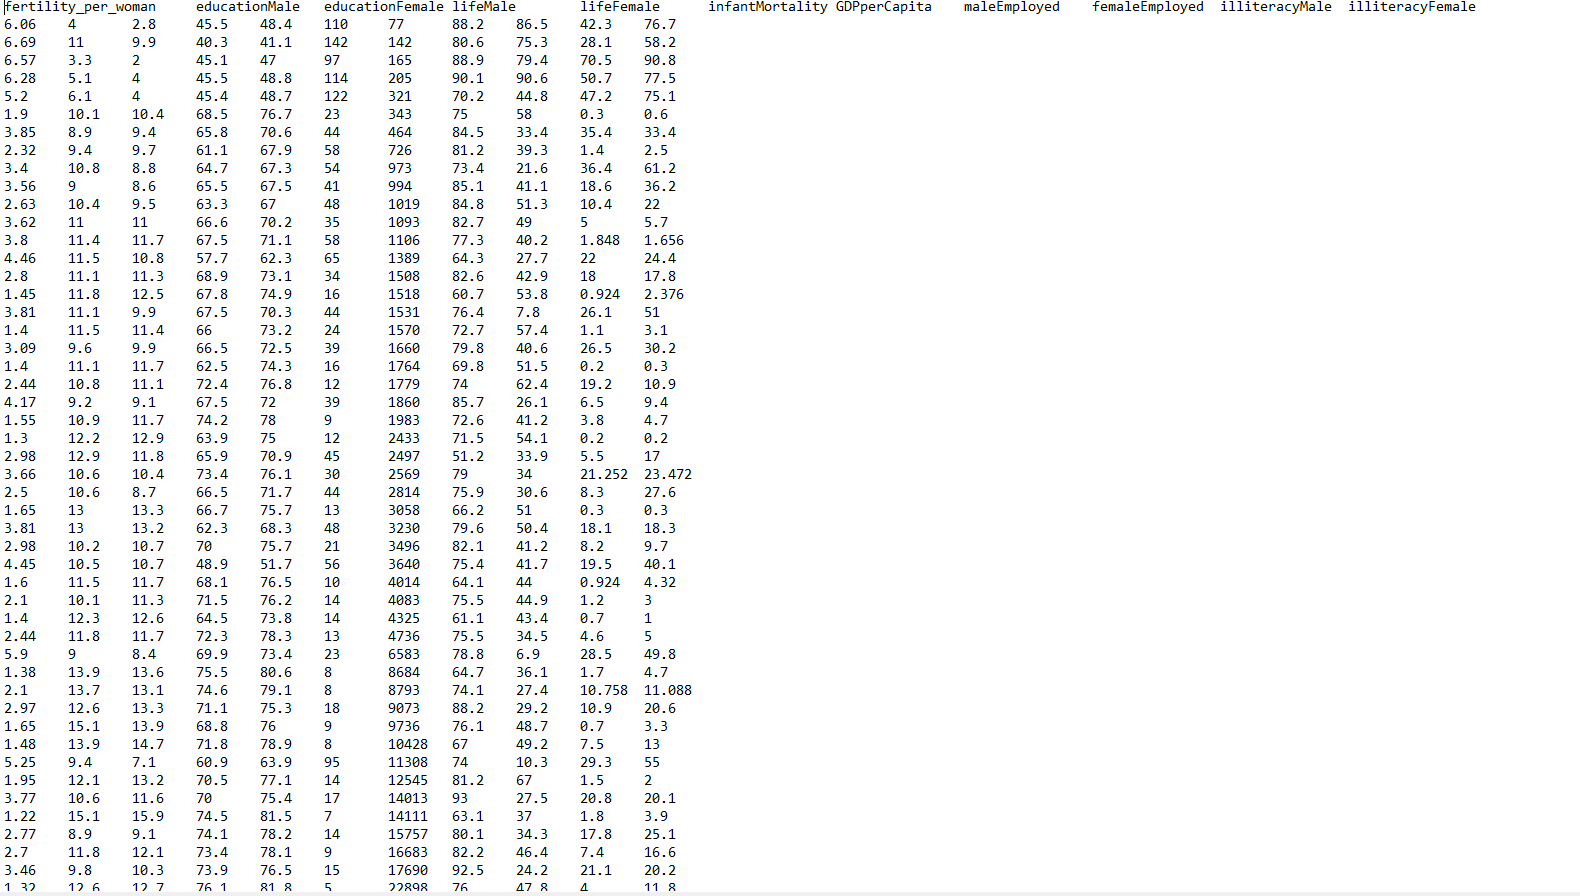
IMPORTANT: For the questions below do not use any loops. All data extraction can be done using Boolean/relational indexing. 1. Download the file, employment_data. txt that contains data for 7 indicators. a. Import the file data into a numpy array. b. Create a plot that compares the employment rate (5th column in the file) with the population (last column in the file). c. Find the first-degree polynomials for the curve fitting these values and produce a plot of the curve in the format shown below. 2. Download the files: cnames. txt and cdata. txt. The first file contains the names and regions of a set of countries. The second file contains quality of life indicator data for the same set of countries in the first file, in the same order. 3. Create a Python script that does the following: a. Using loadtxt, load the country names and regions into a numpy array, c_names, and the quality of life indicator data into a numpy array, data. b. Select all rows from data where the female fertility rate (fertility_per_woman) is below 3 and store as fertility_under_3. c. Store the country/region data (asia_countries) and indicator data (asia_data) for all countries in Asia. d. Using the data from the appropriate numpy arrays, create the plots shown below. Figure 1 Hint: plt.xticks ( rotation =45 ) rotates the ticks on the x-axis. 83,234.289,235.6,159,107.608,1947,60.323 88.5,259.426,232.5,145.6,108.632,1948,61.122 88.2,258.054,368.2,161.6,109.773,1949,60.171 89.5,284.599,335.1,165,110.929,1950,61.187 96.2,328.975,209.9,309.9,112.075,1951,63.221 98.1,346.999,193.2,359.4,113.27,1952,63.639 99,365.385,187,354.7,115.094,1953,64.989 100,363.112,357.8,335,116.219,1954,63.761 101.2,397.469,290.4,304.8,117.388,1955,66.019 104.6,419.18,282.2,285.7,118.734,1956,67.857 108.4,442.769,293.6,279.8,120.445,1957,68.169 110.8,444.546,468.1,263.7,121.95,1958,66.513 112.6,482.704,381.3,255.2,123.366,1959,68.655 114.2,502.601,393.1,251.4,125.368,1960,69.564 115.7,518.173,480.6,257.2,127.852,1961,69.331 116.9,554.894,400.7,282.7,130.081,1962,70.551 E

Step by Step Solution

There are 3 Steps involved in it

Step: 1

blur-text-image

Get Instant Access to Expert-Tailored Solutions

See step-by-step solutions with expert insights and AI powered tools for academic success

Step: 2

blur-text-image

Step: 3

blur-text-image

Ace Your Homework with AI

Get the answers you need in no time with our AI-driven, step-by-step assistance

Get Started

Recommended Textbook for

Mastering Influxdb Database A Comprehensive Guide To Learn Influxdb Database

Authors: Cybellium Ltd ,Kris Hermans

1st Edition

B0CNGGWL7B, 979-8867766450

More Books

Students also viewed these Databases questions

Question

What qualities should a successful manager possess?

Answered: 1 week ago

Question

assess the infl uence of national culture on the workplace

Answered: 1 week ago