

Answered step by step
Verified Expert Solution
Question
1 Approved Answer
Please solve using Rstudio. I attached the graph from slide 90. thanks (a) Try this: x = seq(-5, 5, by = 0.1) y = dnorm
Please solve using Rstudio. I attached the graph from slide 90. thanks
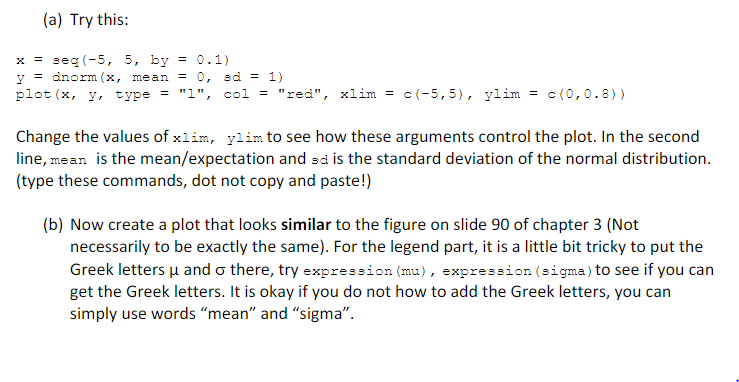
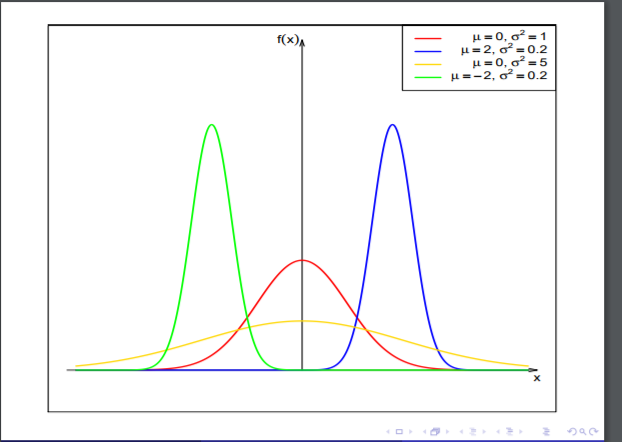
(a) Try this: x = seq(-5, 5, by = 0.1) y = dnorm (x, mean = 0, sd = 1) plot (x, y, type _ "1", col= "red", xlim= c(-5,5), ylim=c(0,0.8)) Change the values of x1n, ylim to see how these arguments control the plot. In the second line, mean is the mean/expectation and sd is the standard deviation of the normal distribution. (type these commands, dot not copy and paste!) (b) Now create a plot that looks similar to the figure on slide 90 of chapter 3 (Not necessarily to be exactly the same). For the legend part, it is a little bit tricky to put the Greek letters and there, try expression (mu) , expression (sigma) to see if you can get the Greek letters. It is okay if you do not how to add the Greek letters, you can simply use words "mean" and "sigmaStep by Step Solution
There are 3 Steps involved in it
Step: 1

Get Instant Access to Expert-Tailored Solutions
See step-by-step solutions with expert insights and AI powered tools for academic success
Step: 2

Step: 3
Ace Your Homework with AI
Get the answers you need in no time with our AI-driven, step-by-step assistance
Get Started
Intranet And Web Databases For Dummies
Authors: Paul Litwin
1st Edition
0764502212, 9780764502217