

Answered step by step
Verified Expert Solution
Question
1 Approved Answer
Please solve with work shown. Problem POS-67B Today is time 0. In the tables below we use two European call options on XYZ stock, both
Please solve with work shown.
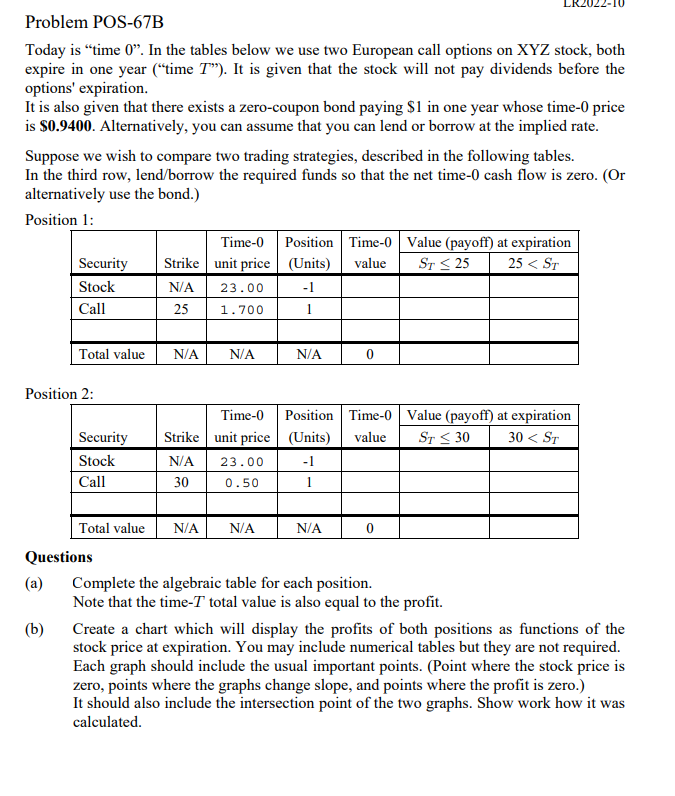
Problem POS-67B Today is "time 0". In the tables below we use two European call options on XYZ stock, both expire in one year ("time T "). It is given that the stock will not pay dividends before the options' expiration. It is also given that there exists a zero-coupon bond paying $1 in one year whose time- 0 price is \$0.9400. Alternatively, you can assume that you can lend or borrow at the implied rate. Suppose we wish to compare two trading strategies, described in the following tables. In the third row, lend/borrow the required funds so that the net time- 0 cash flow is zero. (Or alternatively use the bond.) Position 1. Position ?. Questions (a) Complete the algebraic table for each position. Note that the time- T total value is also equal to the profit. (b) Create a chart which will display the profits of both positions as functions of the stock price at expiration. You may include numerical tables but they are not required. Each graph should include the usual important points. (Point where the stock price is zero, points where the graphs change slope, and points where the profit is zero.) It should also include the intersection point of the two graphs. Show work how it was calculated. Problem POS-67B Today is "time 0". In the tables below we use two European call options on XYZ stock, both expire in one year ("time T "). It is given that the stock will not pay dividends before the options' expiration. It is also given that there exists a zero-coupon bond paying $1 in one year whose time- 0 price is \$0.9400. Alternatively, you can assume that you can lend or borrow at the implied rate. Suppose we wish to compare two trading strategies, described in the following tables. In the third row, lend/borrow the required funds so that the net time- 0 cash flow is zero. (Or alternatively use the bond.) Position 1. Position ?. Questions (a) Complete the algebraic table for each position. Note that the time- T total value is also equal to the profit. (b) Create a chart which will display the profits of both positions as functions of the stock price at expiration. You may include numerical tables but they are not required. Each graph should include the usual important points. (Point where the stock price is zero, points where the graphs change slope, and points where the profit is zero.) It should also include the intersection point of the two graphs. Show work how it was calculatedStep by Step Solution
There are 3 Steps involved in it
Step: 1

Get Instant Access to Expert-Tailored Solutions
See step-by-step solutions with expert insights and AI powered tools for academic success
Step: 2

Step: 3
Ace Your Homework with AI
Get the answers you need in no time with our AI-driven, step-by-step assistance
Get Started
Trade Union Finance
Authors: Marick F. Masters, Raymond Gibney
1st Edition
1032371382, 978-1032371382