Please start with #7. Every time I do it, it comes out wrong and I don't know what I am doing wrong.
Please give detailed step by step instructions, with pictures if possible. Thank you.
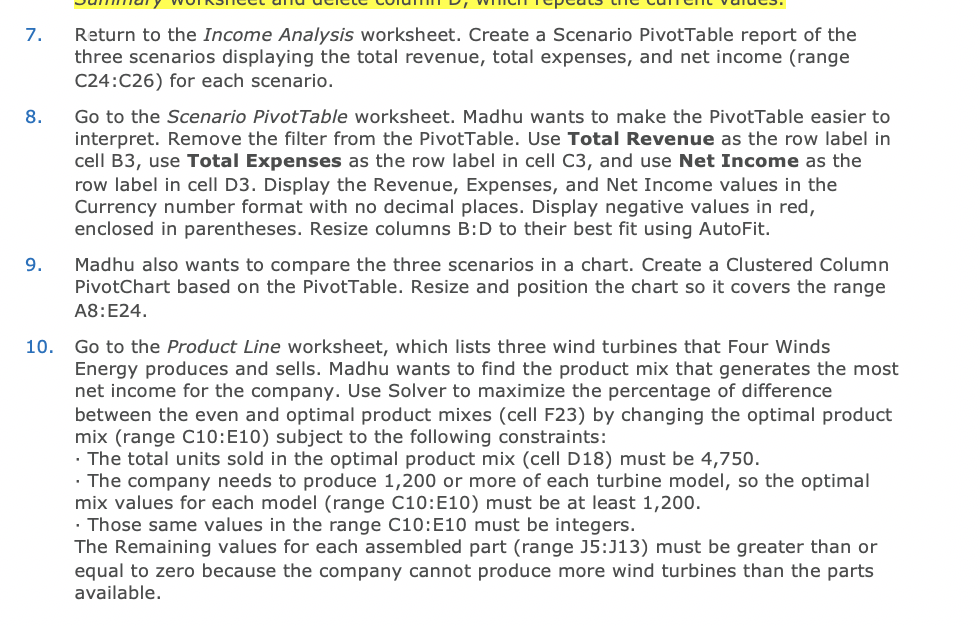
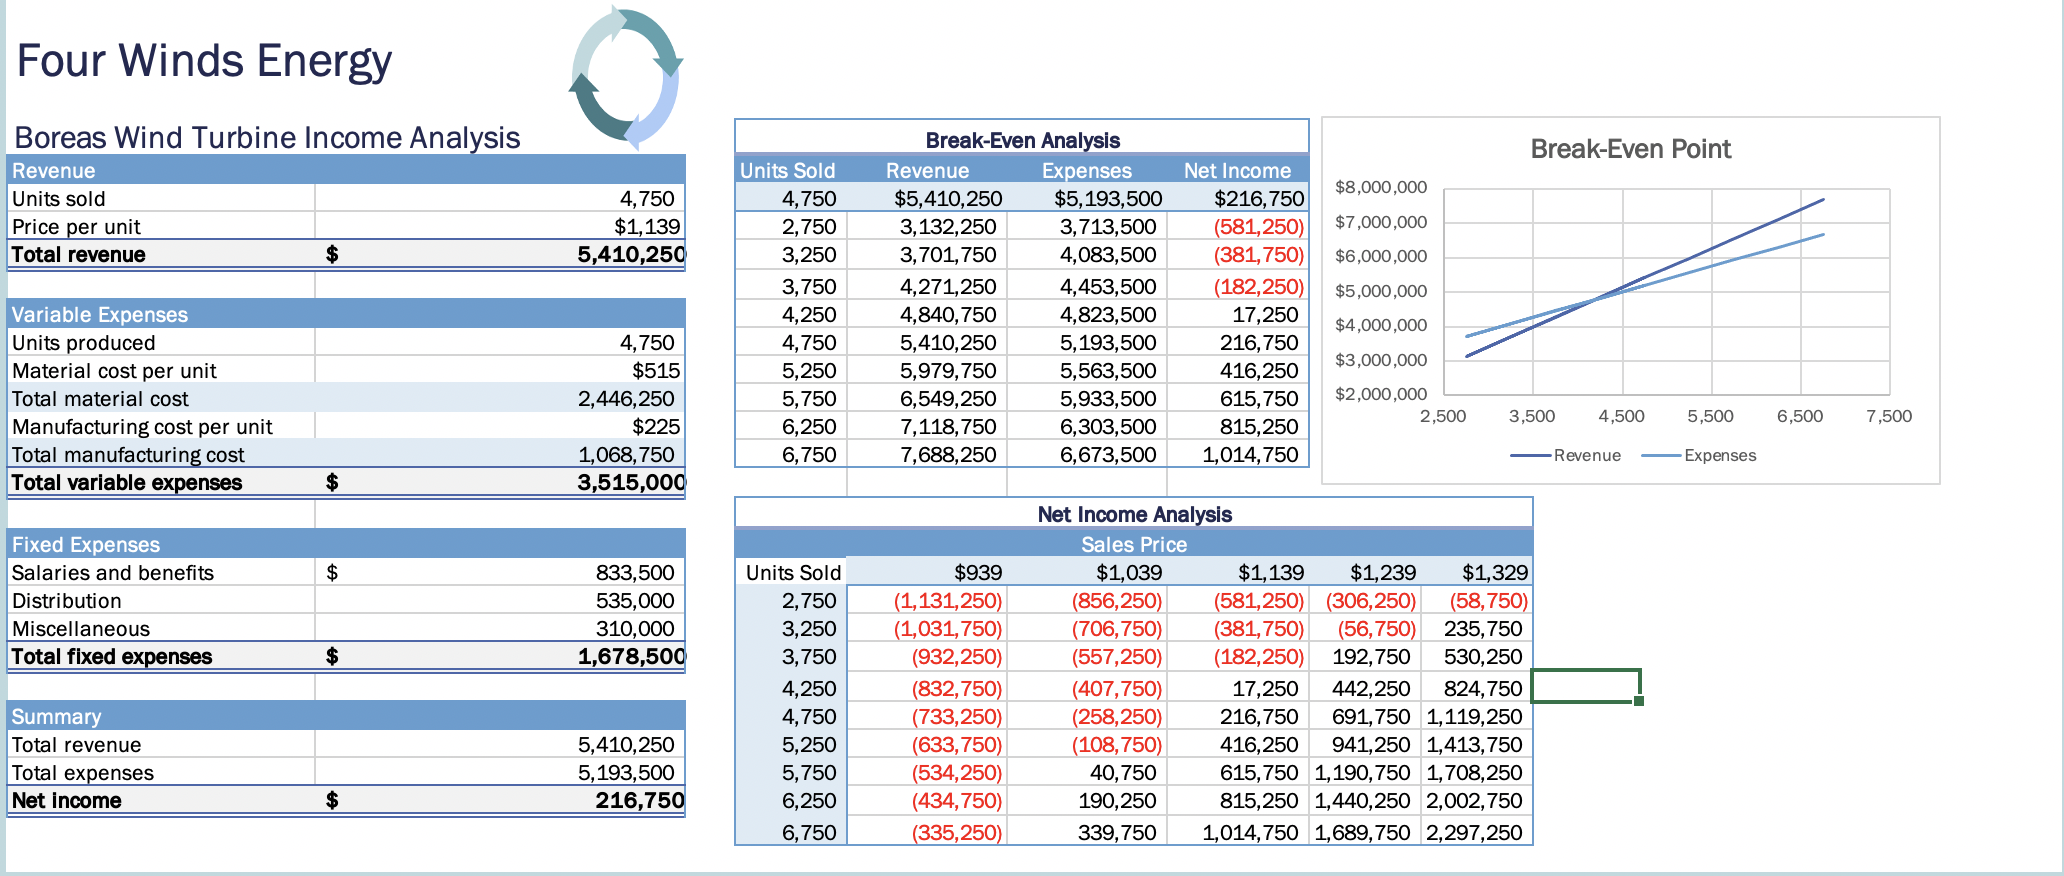
7. 8. Return to the Income Analysis worksheet. Create a Scenario PivotTable report of the three scenarios displaying the total revenue, total expenses, and net income (range C24:C26) for each scenario. Go to the Scenario Pivot Table worksheet. Madhu wants to make the PivotTable easier to interpret. Remove the filter from the PivotTable. Use Total Revenue as the row label in cell B3, use Total Expenses as the row label in cell C3, and use Net Income as the row label in cell D3. Display the Revenue, Expenses, and Net Income values in the Currency number format with no decimal places. Display negative values in red, enclosed in parentheses. Resize columns B:D to their best fit using AutoFit. Madhu also wants to compare the three scenarios in a chart. Create a Clustered Column PivotChart based on the PivotTable. Resize and position the chart so it covers the range A8:E24. 9. 10. Go to the Product Line worksheet, which lists three wind turbines that Four Winds Energy produces and sells. Madhu wants to find the product mix that generates the most net income for the company. Use Solver to maximize the percentage of difference between the even and optimal product mixes (cell F23) by changing the optimal product mix (range C10:E10) subject to the following constraints: The total units sold in the optimal product mix (cell D18) must be 4,750. The company needs to produce 1,200 or more of each turbine model, so the optimal mix values for each model (range C10:E10) must be at least 1,200. Those same values in the range C10:E10 must be integers. The Remaining values for each assembled part (range 05:J13) must be greater than or equal to zero because the company cannot produce more wind turbines than the parts available. Four Winds Energy Break-Even Point Boreas Wind Turbine Income Analysis Revenue Units sold Price per unit Total revenue $ $8,000,000 4,750 $1,139 5,410,250 $7,000,000 $6,000,000 Break-Even Analysis Revenue Expenses $5,410,250 $5,193,500 3, 132,250 3,713,500 3,701,750 4,083,500 4,271,250 4,453,500 4,840,750 4,823,500 5,410,250 5,193,500 5,979,750 5,563,500 6,549,250 5,933,500 7,118,750 6,303,500 7,688,250 6,673,500 $5,000,000 Units Sold 4,750 2,750 3,250 3,750 4,250 4,750 5,250 5,750 6,250 6,750 Net Income $216,750 (581,250) (381,750) (182,250) 17,250 216,750 416,250 615,750 815,250 1,014,750 Variable Expenses Units produced Material cost per unit Total material cost Manufacturing cost per unit Total manufacturing cost Total variable expenses $4,000,000 $3,000,000 4,750 $515 2,446,250 $225 1,068,750 3,515,000 $2,000,000 2,500 3,500 4,500 5,500 6,500 7,500 Revenue -Expenses $ $ Fixed Expenses Salaries and benefits Distribution Miscellaneous Total fixed expenses 833,500 535,000 310,000 1,678,500 $ Units Sold 2,750 3,250 3,750 4,250 4,750 5,250 5,750 6,250 6,750 $939 (1,131,250) (1,031,750) (932,250) (832,750) (733,250) (633,750) (534,250) (434,750) (335,250) Net Income Analysis Sales Price $1,039 $1,139 $1,239 $1,329 (856,250) (581,250) (306,250) (58,750) (706,750) (381,750) (56,750) 235,750 (557,250) (182,250) 192,750 530,250 (407,750) 17,250 442,250 824,750 (258,250) 216,750 691,750 1,119,250 (108,750) 416,250 941,250 1,413,750 40,750 615,750 1,190,750 1,708,250 190,250 815,250 1,440,250 2,002,750 339,750 1,014,750 1,689,750 2,297,250 Summary Total revenue Total expenses Net income 5,410,250 5,193,500 216,750 $ 7. 8. Return to the Income Analysis worksheet. Create a Scenario PivotTable report of the three scenarios displaying the total revenue, total expenses, and net income (range C24:C26) for each scenario. Go to the Scenario Pivot Table worksheet. Madhu wants to make the PivotTable easier to interpret. Remove the filter from the PivotTable. Use Total Revenue as the row label in cell B3, use Total Expenses as the row label in cell C3, and use Net Income as the row label in cell D3. Display the Revenue, Expenses, and Net Income values in the Currency number format with no decimal places. Display negative values in red, enclosed in parentheses. Resize columns B:D to their best fit using AutoFit. Madhu also wants to compare the three scenarios in a chart. Create a Clustered Column PivotChart based on the PivotTable. Resize and position the chart so it covers the range A8:E24. 9. 10. Go to the Product Line worksheet, which lists three wind turbines that Four Winds Energy produces and sells. Madhu wants to find the product mix that generates the most net income for the company. Use Solver to maximize the percentage of difference between the even and optimal product mixes (cell F23) by changing the optimal product mix (range C10:E10) subject to the following constraints: The total units sold in the optimal product mix (cell D18) must be 4,750. The company needs to produce 1,200 or more of each turbine model, so the optimal mix values for each model (range C10:E10) must be at least 1,200. Those same values in the range C10:E10 must be integers. The Remaining values for each assembled part (range 05:J13) must be greater than or equal to zero because the company cannot produce more wind turbines than the parts available. Four Winds Energy Break-Even Point Boreas Wind Turbine Income Analysis Revenue Units sold Price per unit Total revenue $ $8,000,000 4,750 $1,139 5,410,250 $7,000,000 $6,000,000 Break-Even Analysis Revenue Expenses $5,410,250 $5,193,500 3, 132,250 3,713,500 3,701,750 4,083,500 4,271,250 4,453,500 4,840,750 4,823,500 5,410,250 5,193,500 5,979,750 5,563,500 6,549,250 5,933,500 7,118,750 6,303,500 7,688,250 6,673,500 $5,000,000 Units Sold 4,750 2,750 3,250 3,750 4,250 4,750 5,250 5,750 6,250 6,750 Net Income $216,750 (581,250) (381,750) (182,250) 17,250 216,750 416,250 615,750 815,250 1,014,750 Variable Expenses Units produced Material cost per unit Total material cost Manufacturing cost per unit Total manufacturing cost Total variable expenses $4,000,000 $3,000,000 4,750 $515 2,446,250 $225 1,068,750 3,515,000 $2,000,000 2,500 3,500 4,500 5,500 6,500 7,500 Revenue -Expenses $ $ Fixed Expenses Salaries and benefits Distribution Miscellaneous Total fixed expenses 833,500 535,000 310,000 1,678,500 $ Units Sold 2,750 3,250 3,750 4,250 4,750 5,250 5,750 6,250 6,750 $939 (1,131,250) (1,031,750) (932,250) (832,750) (733,250) (633,750) (534,250) (434,750) (335,250) Net Income Analysis Sales Price $1,039 $1,139 $1,239 $1,329 (856,250) (581,250) (306,250) (58,750) (706,750) (381,750) (56,750) 235,750 (557,250) (182,250) 192,750 530,250 (407,750) 17,250 442,250 824,750 (258,250) 216,750 691,750 1,119,250 (108,750) 416,250 941,250 1,413,750 40,750 615,750 1,190,750 1,708,250 190,250 815,250 1,440,250 2,002,750 339,750 1,014,750 1,689,750 2,297,250 Summary Total revenue Total expenses Net income 5,410,250 5,193,500 216,750 $