Please summarize based on the follwing infornation the quration
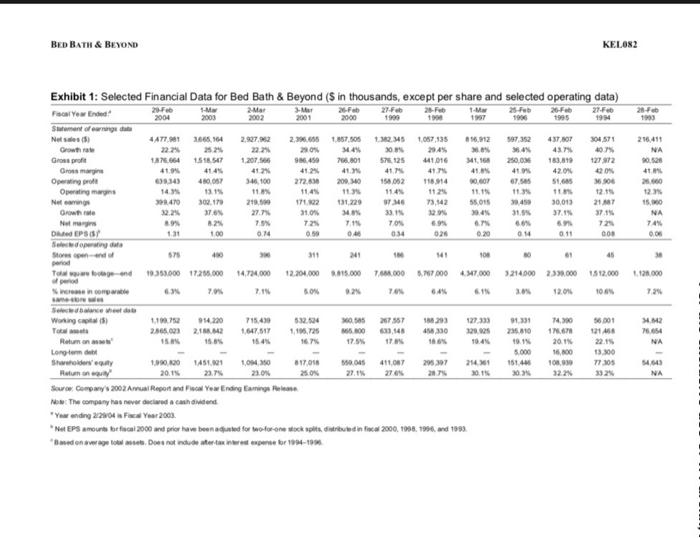
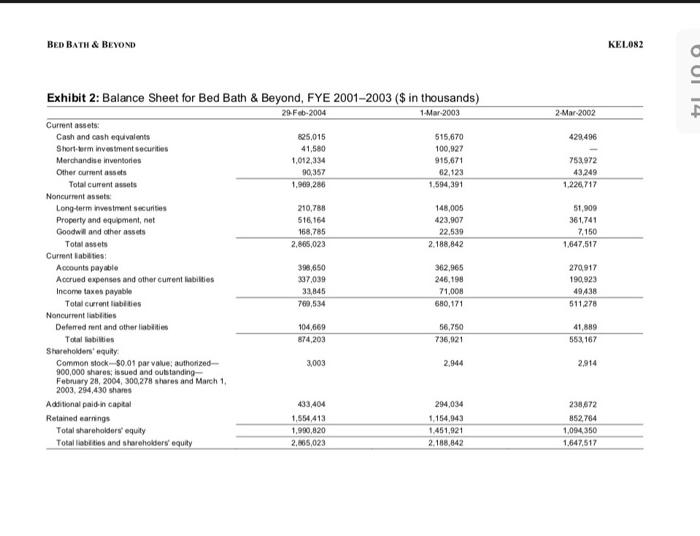
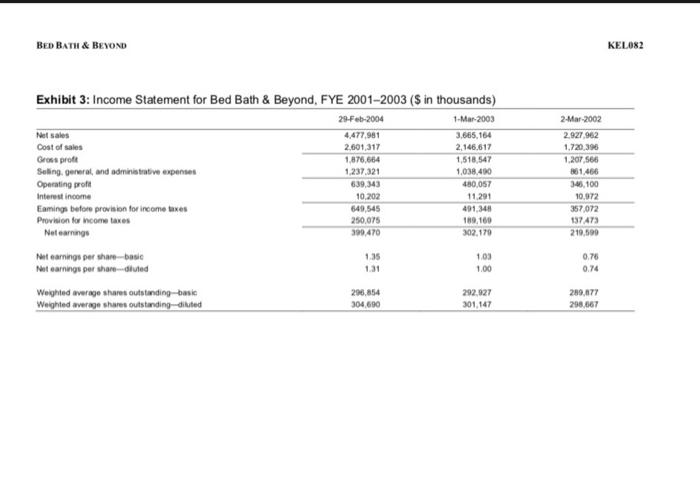
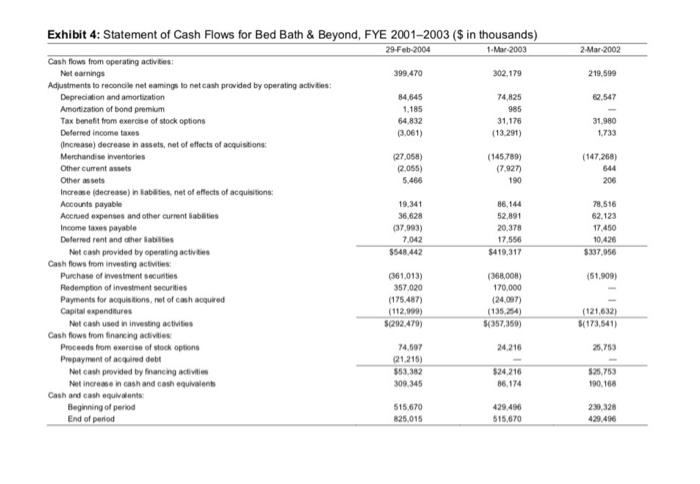
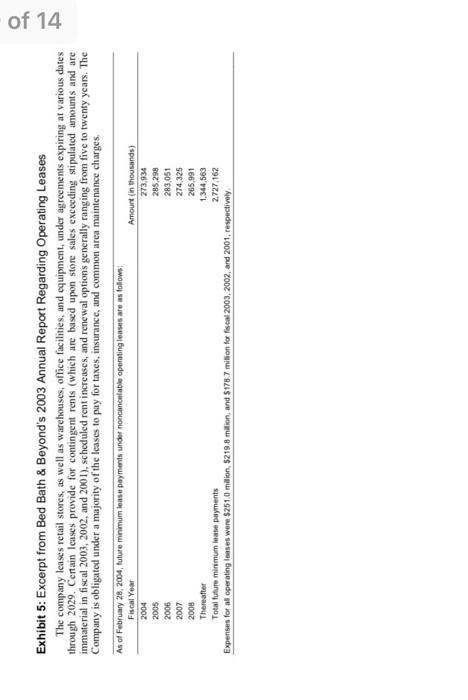
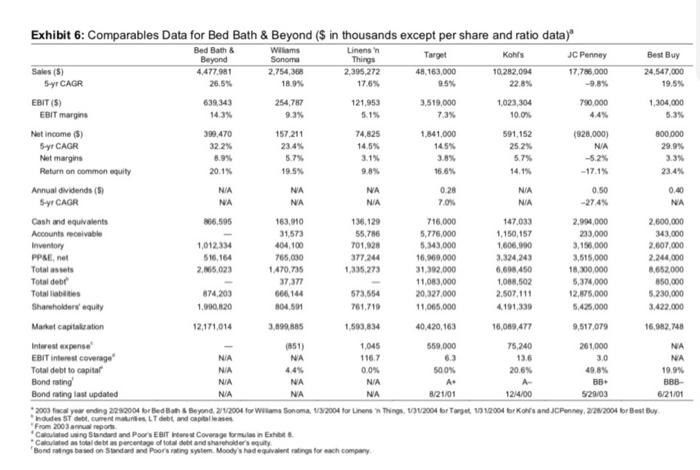
- How would you characterize the business risk of Bed Bath & Beyond? Review their then current financial performance.
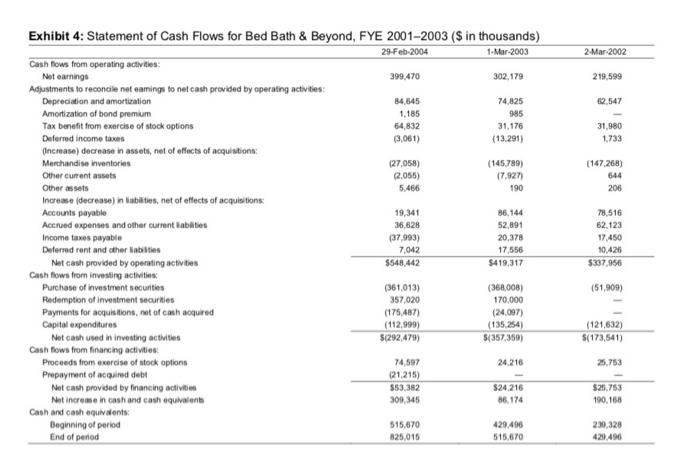
- Does BBBY have too much cash? Why do you think so?
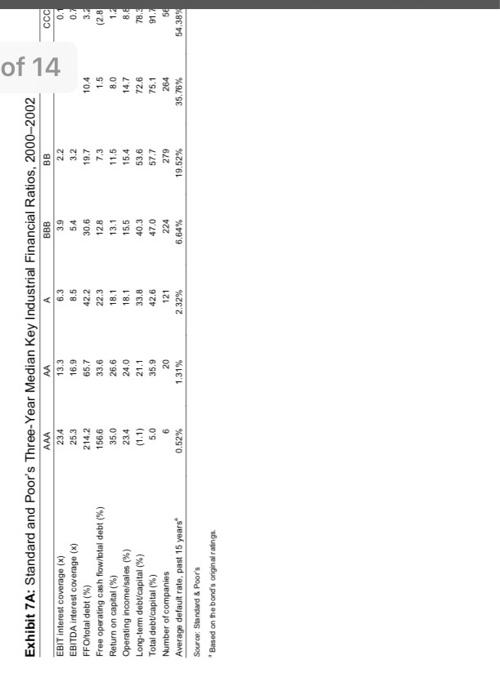
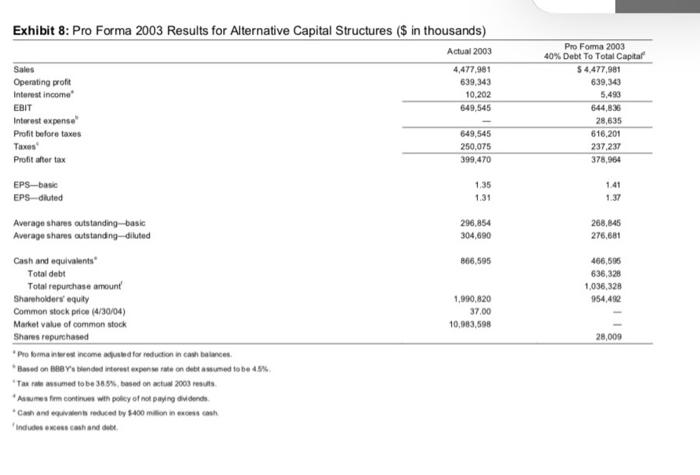
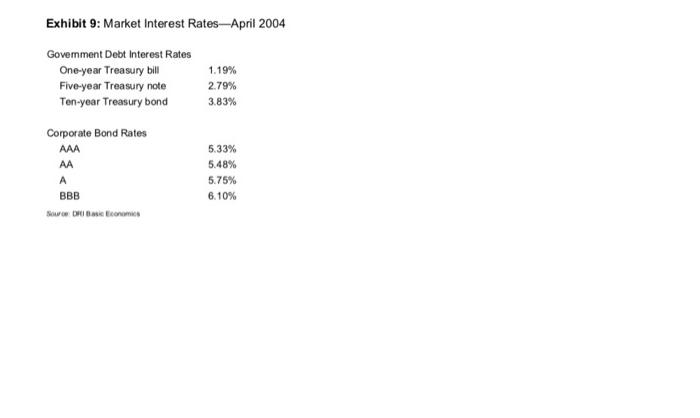
- How could Bed Bath distribute cash to shareholders and what trade-offs should they consider?
BED BATH & BEYOND KELON2 25-F 1993 216,411 NA 0526 41 2.600 Exhibit 1: Selected Financial Data for Bed Bath & Beyond (S in thousands, except per share and selected operating data) Focal Year Ended -M 2-Mar 3-M 26-Feb 27 Feb - 2004 25-Feb 2002 26- 27-F 2000 1996 Stofamentowe Neses) SAT.1 3665.164 2.27 2.3.65 1.867.505 12345 1057,935 597352 437 SOT Growth 22.7% 20% 14:49 30 2945 Gross profit 127.664 1518.547 1207 96.450 736.801 578125 41016 11.16 2500M 163,899 127872 Grosse 41.94 4145 41 41 41 41 41. 41 42.0% 120 Operating 6345 4007 346.100 272.850 200140 158052 118.914 OP 67. 51.0 6.900 Operating na 14 13.15 11 1125 11.15 11.3 11 Net 2.470 302.17 21,1 17122 131220 ST 73,142 55.018 1.450 30.013 21 re 22 37 37.15 371 Nam 70 72 71 TON 69 6.09 721 DEPS 0.14 0.50 0.40 0.20 014 Sedute 011 008 578 40 311 241 141 100 61 Tallend 19.353.000 17.265.000 14,724.000 12.204.000 15.000 76.000 5.767000 47.000 3.214000 238.000 1512.000 70 50 92 TON w 12.04 100N 15.00 NA 74 0 0 0.3 020 30 120.000 72 SAM 218 NA 91331 100 23.010 11. 19.1 20.1% 5.000 16.00 161.44 10.00 303 322 13.300 72.30 392 NA Working 1.10075 914.220 715.490 52.4 055 27557 1293 127333 To 2.366.0032.11.12 1.647.517 1.10.28 MS 800 2,541 459 300 320025 Rauman 15 15.45 167 17.8% 11 10:45 Longform were 1.990.00 51.0 LON *17.01 0.04 411,087 29.397 21 Runway 2015 23.7% 23.0% 27.1 27.05 20.7% Sow Company 2002 Aral Reportinda Yew Ending Caring Now The company has never dictwed cashed *Year ending 2204 Year 2003 *Net EPS amour braculi 2000 and peer how been added for motor one stock pita, insbundin fiscal 2000, 1808.1996 and 1898. Beden were Does not deterre- BED BATH & BEYOND KELO82 OUI 14 2-Mar-2002 429496 752.972 43,249 1.226.717 51,909 361,741 7,150 1.647,517 Exhibit 2: Balance Sheet for Bed Bath & Beyond, FYE 2001-2003 ($ in thousands) 29 Feb-2004 1-Mar-2003 Current assets: Cash and cash equivalents $25,015 515,670 Short-term investment securities 41.580 100,927 Merchandise inventories 1,012,334 915,671 Other current assets 90,357 62,123 Total current assets 1,909,286 1.594,391 Noncurrent assets Long-term investment securities 210,788 148,005 Property and equipment, not 516,164 423,907 Goodwill and other assets 168,785 22,539 Total assets 2.865,023 2.188,842 Current liabilities: Accounts payable 398,650 362,965 Accrued expenses and other current liabilities 337,039 246,198 Income taxes payable 33,845 71.008 Total current librities 760,534 680,171 Noncurrent liabilities Deferred rent and other liabilities 104,669 56,750 Total abilities 874,203 736,921 Shareholders' equity Common stock - $0.01 par value: authorized 3,003 2,944 900,000 shares, issued and outstanding February 28, 2004, 300278 shares and March 1 2003, 294,430 shares Additional paid-in capital 433,404 294,034 Retained earnings 1,554,413 1.154,943 Total shareholders' equity 1,990,020 1.451,921 Total liabilities and shareholders' equity 2,105,023 2.188,842 270,917 190,923 49438 511,278 41,889 553 167 2.914 238,672 852764 1,094,350 1.647,517 BED BATH & BEYOND KEL082 Exhibit 3: Income Statement for Bed Bath & Beyond, FYE 2001-2003 (s in thousands) 29-Feb-2004 1-Mar-2003 Net sales 4,477,981 3.665,164 Cost of sales 2,601,317 2.146.617 Gross prole 1.876,664 1,518,547 Selling, pereral, and administrative expenses 1.237.321 1.038.400 Operating profil 639,343 480,057 Interest income 10.202 11.291 Eaming before provision for income taxes 649,545 491,348 Provision for income taxes 250.075 189,160 Net earnings 399.470 302,170 2-Mar-2002 2.927.962 1.720,390 1,207,566 1.466 3:45.100 10.972 357072 137473 219,599 Net earnings per share-basic Net earnings por share duted 1.35 131 103 1.00 0.76 0.74 Weighted average shares outstanding basic Weighted average share outstanding-dinted 206.854 304,690 292.927 301,147 289,677 298.667 2-Mar-2002 219,599 2.547 31,980 1.733 (147.268) 644 206 Exhibit 4: Statement of Cash Flows for Bed Bath & Beyond, FYE 2001-2003 ($ in thousands) 29-Feb-2004 1-Mar-2003 Cash flows from operating activities: Net earnings 399.470 302.179 Adjustments to reconcile net eaming to net cash provided by operating activities: Depreciation and amortization 84,645 74.825 Amortization of bond premium 1.185 985 Tax benefit from exercise of stock options 64,832 31,176 Deferred income taxes 3,061) (13.291) Incmase) decrease in assets, net at affects of acquisitions: Merchandise inventories (27,058) (145.789) Other current assets 2,055) 17,9271 Other assets 5.466 190 Increase (decrease in inbitesnet of affects of acquisitions: Accounts payable 19,341 86,144 Accrued expenses and other current abilities 36.628 52,891 Income taxes payable (37,993) 20,378 Deferred rent and other abilities 7,042 17.556 Net cash provided by operating activities $548,442 5419,317 Cash flows from investing activities Purchase of investment securities (361,013) (368,008) Redemption of investment securities 357,020 170,000 Payments for acquisitions, not of cash acquired (175,487) (24,007) Capital expenditures (112.999) (135.254) Net cash used in investing activities 5(292,479) $(357,369) Cash flows from financing activities Proceeds from exercise of stock options 74,597 24.216 Prepayment of acquired debt (21215) Not cash provided by financing activities $53,382 $24.216 Not increme in cash and cash equivalent 309,345 16.174 Cash and cash equivalents: Beginning of period 515,670 429.490 End of period 825.015 515,670 78,516 62.123 17.450 10.426 $337,956 (51,909) (121.632) $(173,541) 25,753 $25.753 190.168 230,328 429.490 2-Mar-2002 219.599 2.547 64.832 31.980 1.733 (147.268) 544 190 206 Exhibit 4: Statement of Cash Flows for Bed Bath & Beyond, FYE 2001-2003 ($ in thousands) 29 Feb-2004 1. Mar 2003 Cash flows from operating activities Net earnings 399.470 302.179 Adjustments to reconcile net camins to net cash provided by operating activities Depreciation and amortization 84,645 74,825 Amortization of bond premium 1.185 985 Tax benefit from exercise of stock options 31,176 Deferred income taxes (3.061) (13291) Increase) decrease in assets, net of effects of acquisitions: Merchandise nventories (27.058) (145789) Other current sets 12.055) (7.927 Other assets 5.466 Increme (decrease) habes, net of effects of acquisitions: Accounts payable 19.341 86,144 Accrued expenses and other current abilities 36,628 52,891 Income les payable (37.993) 20,378 Deferred rent and other lates 7.042 17.556 Not cash provided by operating activities $548.442 $419,317 Cash flows from investing activities Purchase of investment securities (361,013) (368,008) Redemption of investment securities 357.020 170,000 Payments for acquisitions, not of cash acquired (175.487) (24.007) Capital expenditures (112.00) (135.254) Net cash used in investing activities $(292.479) 5(357,350) Cash flows from financing activities Proceeds from exercise of stock options 74,607 24.216 Prepayment of acquired debt (21.215) Not cash provided by financing activities $53,382 $24.216 Not increase in cash and chequivalent 309.345 86.174 Cash and cash equivat Beginning of period 515,670 429 430 End of period 825,015 515,670 78,516 62.123 17.450 10.420 $337.056 (51.909) (121632) (173,541) 25,753 525.753 190,168 230,328 429.496 of 14 Exhibit 5: Excerpt from Bed Bath & Beyond's 2003 Annual Report Regarding Operating Leases The company cases retail stores, as well as warehouses, office facilities, and equipment, under agreements expiring at various dates through 2029. Certain Icases provide for contingent rents (which are based upon store sales exceeding stipulated amounts and are immaterial in fiscal 2003, 2002, and 2001), scheduled rent increases, and renewal options generally ranging from five to twenty years. The Company is obligated under a majority of the leases to pay for taxes, insurance, and common area maintenance charges. As of February 28, 2004, future minimum lease payments under noncancalable operating leases are as follows Fiscal Year Amount (in thousands) 2004 273,934 285,298 2005 2006 283,051 2007 274,325 2008 265,991 1,344,563 Thereafter Total future minimum lase payments 2.727,162 Expenses for all operating lases were $251.0 million $219.8 milion, and $1787 million for fiscal 2003, 2002, and 2001, respectively 22.8% Exhibit 6: Comparables Data for Bed Bath & Beyond (S in thousands except per share and ratio data)" Bed Bath & Williams Linens Beyond Sonora Things Target Kohl's JC Penney Best Buy Sales (5) 4,477,981 2,754,368 2,395,272 48,163,000 10,282,004 17,786,000 24.547,000 5yr CAGR 26.6% 18.9% 17.6% 9.5% -9.8% 19.5% EBIT (5) 639,343 254,787 121,953 3,519,000 1,023,304 750.000 1,304.000 EBIT margins 14.3% 9.3% 5.15 73% 100% 4.4% 5.3% Not income (5) 399.470 157.211 74,825 1.841,000 591.152 (928,000) 800.000 5yr CAGR 32.2% 23.4% 14.5% 14.5% 25.2% NA 29.9% Netmargins 8.9% 5.7% 3.8% 5.7% -5.2% 3.3% Return on common equity 20.1% 19.5% 9.8% 16.6% 14.1% -17.1% Annual dividends ( NIA NA NA 0.28 NIA 0.50 0.40 Syr CAGR NA NA NIA 70% NIA -27.4% NA Cash and equivalents 366.505 163,910 136,129 716,000 147,033 2.994.000 2,600,000 Accounts receivable 31,573 55,786 5,776,000 1.150.157 233.000 343.000 Inventory 1,012.334 404.100 701,020 5.343,000 1.606,000 3,156,000 2.607.000 PPRE.net 516,164 765,000 377.244 16,000,000 3.324 243 3,515,000 2.244.000 Total 2.5.023 1470,735 1,335,273 31.392.000 6,608,450 18,300,000 8.652.000 Total debe 37,377 11,063,000 1,088,502 5,374,000 850,000 Total liabilities 874205 666144 573,554 20,327.000 2.507,111 12,875,000 5.230.000 Shareholders equity 1,080,120 104,501 761,719 11,065,000 4.191,330 5,425,000 3,422,000 Market capitalization 12.171,014 3.699.885 1.595.834 40.420,163 16,089,477 9,517,079 16,92743 Interest expense (851) 1.045 550,000 75.240 261,000 NA EBIT interest coverage NIA NA 1167 63 13.6 3.0 NA Total debt to capital NA 0.0% 20.6% 49.8% 19.9% Bond rating NIA NA NA BB 38B- Bond rating last updated N/A NA 8/21/01 12/4/00 529103 6/21/01 2003 facel your ending 22:2004 br Bed and Beyond, 292004 for Wiams Sonoma, 73/2004 to Linens Things, UX2004 br Torpet 1012004 br Kohe and JCPenney, 229/2004 br Best Buy From 2003 annual report Coated wing Standard and Poor's Eat Worst Coverage formen Exhibit Castoldebt percentage of totalt and shareholder's quity Bond based on Standard and Poor's wing system. Moody's hodettings for each company SOON NA of 14 13.3 1.5 Exhibit 7A: Standard and Poor's Three-Year Median Key Industrial Financial Ratios, 2000-2002 AAA AA BBB BB EBIT interest coverage (*) 234 6.3 3.9 2.2 EBITDA interest coverage (*) 25.3 16.9 8.5 54 3.2 FFOotal debt (%) 214,2 65.7 42.2 30.6 19.7 10.4 Free operating cash flow/etal debt (%) 156.6 33.6 22.3 128 7.3 Return on capital (%) 35.0 26.6 18.1 13.1 11.5 8.0 Operating income/sales (%) 234 24.0 18.1 15,5 15.4 14.7 Long-term debUcapital (%) (1.1) 21.1 33.8 53.6 72.6 Total debt capital (%) 5.0 35.9 42.6 470 57.7 75.1 Number of companies 6 20 121 224 279 264 Average default rate, past 15 years 0.52% 1.31% 2.32% 6.64% 19.52% 35.76% Source: Standard & Poor's Based on the bonds original ratings 0.1 0.1 3.2 (28 1.2 8.8 78. 91.7 5 54,38% 40.3 Exhibit 8: Pro Forma 2003 Results for Alternative Capital Structures ($ in thousands) Actual 2003 Sales Operating profit Interest income 4,477,981 639,343 10,202 649,545 EBIT Pro Forma 2003 40% Debt To Total Capital $ 4,477,981 639,343 5,493 644,836 28,635 616,201 237,237 378,964 Interest expense Profit before taxes Taxes Profit after tax EPS-basic EPS-diluted 649,545 250.075 399,470 1.35 1.31 1.41 1.37 Average shares outstanding basic Average shares outstanding-diluted 296,854 304,690 268,845 276,681 166,595 466,595 636,328 1,036,328 954,492 1,990, 820 37.00 10.083,598 28,000 Cash and equivalents Total debt Total repurchase amount Shareholders' equity Common stock price (0/30/04) Market value of common stock Shares repurchased Proforma interest income and for reduction in cau balaca *Based on sede interest expension detta umed to be 43% Tax rate assumed to be 38.8%ed on actus 2003 results *Assumes for continues win poley of not paying duidends *Cash and events reduced by S400 million in ross cash Indudes excess cash and be Exhibit 9: Market Interest Rates-April 2004 Goverment Debt Interest Rates One-year Treasury bill Five-year Treasury note Ten-year Treasury bond 1.19% 2.79% 3.83% Corporate Bond Rates AAA AA A 5.33% 5.48% 5.75% 6.10% BBB Sowo DRI Beconomic BED BATH & BEYOND KELON2 25-F 1993 216,411 NA 0526 41 2.600 Exhibit 1: Selected Financial Data for Bed Bath & Beyond (S in thousands, except per share and selected operating data) Focal Year Ended -M 2-Mar 3-M 26-Feb 27 Feb - 2004 25-Feb 2002 26- 27-F 2000 1996 Stofamentowe Neses) SAT.1 3665.164 2.27 2.3.65 1.867.505 12345 1057,935 597352 437 SOT Growth 22.7% 20% 14:49 30 2945 Gross profit 127.664 1518.547 1207 96.450 736.801 578125 41016 11.16 2500M 163,899 127872 Grosse 41.94 4145 41 41 41 41 41. 41 42.0% 120 Operating 6345 4007 346.100 272.850 200140 158052 118.914 OP 67. 51.0 6.900 Operating na 14 13.15 11 1125 11.15 11.3 11 Net 2.470 302.17 21,1 17122 131220 ST 73,142 55.018 1.450 30.013 21 re 22 37 37.15 371 Nam 70 72 71 TON 69 6.09 721 DEPS 0.14 0.50 0.40 0.20 014 Sedute 011 008 578 40 311 241 141 100 61 Tallend 19.353.000 17.265.000 14,724.000 12.204.000 15.000 76.000 5.767000 47.000 3.214000 238.000 1512.000 70 50 92 TON w 12.04 100N 15.00 NA 74 0 0 0.3 020 30 120.000 72 SAM 218 NA 91331 100 23.010 11. 19.1 20.1% 5.000 16.00 161.44 10.00 303 322 13.300 72.30 392 NA Working 1.10075 914.220 715.490 52.4 055 27557 1293 127333 To 2.366.0032.11.12 1.647.517 1.10.28 MS 800 2,541 459 300 320025 Rauman 15 15.45 167 17.8% 11 10:45 Longform were 1.990.00 51.0 LON *17.01 0.04 411,087 29.397 21 Runway 2015 23.7% 23.0% 27.1 27.05 20.7% Sow Company 2002 Aral Reportinda Yew Ending Caring Now The company has never dictwed cashed *Year ending 2204 Year 2003 *Net EPS amour braculi 2000 and peer how been added for motor one stock pita, insbundin fiscal 2000, 1808.1996 and 1898. Beden were Does not deterre- BED BATH & BEYOND KELO82 OUI 14 2-Mar-2002 429496 752.972 43,249 1.226.717 51,909 361,741 7,150 1.647,517 Exhibit 2: Balance Sheet for Bed Bath & Beyond, FYE 2001-2003 ($ in thousands) 29 Feb-2004 1-Mar-2003 Current assets: Cash and cash equivalents $25,015 515,670 Short-term investment securities 41.580 100,927 Merchandise inventories 1,012,334 915,671 Other current assets 90,357 62,123 Total current assets 1,909,286 1.594,391 Noncurrent assets Long-term investment securities 210,788 148,005 Property and equipment, not 516,164 423,907 Goodwill and other assets 168,785 22,539 Total assets 2.865,023 2.188,842 Current liabilities: Accounts payable 398,650 362,965 Accrued expenses and other current liabilities 337,039 246,198 Income taxes payable 33,845 71.008 Total current librities 760,534 680,171 Noncurrent liabilities Deferred rent and other liabilities 104,669 56,750 Total abilities 874,203 736,921 Shareholders' equity Common stock - $0.01 par value: authorized 3,003 2,944 900,000 shares, issued and outstanding February 28, 2004, 300278 shares and March 1 2003, 294,430 shares Additional paid-in capital 433,404 294,034 Retained earnings 1,554,413 1.154,943 Total shareholders' equity 1,990,020 1.451,921 Total liabilities and shareholders' equity 2,105,023 2.188,842 270,917 190,923 49438 511,278 41,889 553 167 2.914 238,672 852764 1,094,350 1.647,517 BED BATH & BEYOND KEL082 Exhibit 3: Income Statement for Bed Bath & Beyond, FYE 2001-2003 (s in thousands) 29-Feb-2004 1-Mar-2003 Net sales 4,477,981 3.665,164 Cost of sales 2,601,317 2.146.617 Gross prole 1.876,664 1,518,547 Selling, pereral, and administrative expenses 1.237.321 1.038.400 Operating profil 639,343 480,057 Interest income 10.202 11.291 Eaming before provision for income taxes 649,545 491,348 Provision for income taxes 250.075 189,160 Net earnings 399.470 302,170 2-Mar-2002 2.927.962 1.720,390 1,207,566 1.466 3:45.100 10.972 357072 137473 219,599 Net earnings per share-basic Net earnings por share duted 1.35 131 103 1.00 0.76 0.74 Weighted average shares outstanding basic Weighted average share outstanding-dinted 206.854 304,690 292.927 301,147 289,677 298.667 2-Mar-2002 219,599 2.547 31,980 1.733 (147.268) 644 206 Exhibit 4: Statement of Cash Flows for Bed Bath & Beyond, FYE 2001-2003 ($ in thousands) 29-Feb-2004 1-Mar-2003 Cash flows from operating activities: Net earnings 399.470 302.179 Adjustments to reconcile net eaming to net cash provided by operating activities: Depreciation and amortization 84,645 74.825 Amortization of bond premium 1.185 985 Tax benefit from exercise of stock options 64,832 31,176 Deferred income taxes 3,061) (13.291) Incmase) decrease in assets, net at affects of acquisitions: Merchandise inventories (27,058) (145.789) Other current assets 2,055) 17,9271 Other assets 5.466 190 Increase (decrease in inbitesnet of affects of acquisitions: Accounts payable 19,341 86,144 Accrued expenses and other current abilities 36.628 52,891 Income taxes payable (37,993) 20,378 Deferred rent and other abilities 7,042 17.556 Net cash provided by operating activities $548,442 5419,317 Cash flows from investing activities Purchase of investment securities (361,013) (368,008) Redemption of investment securities 357,020 170,000 Payments for acquisitions, not of cash acquired (175,487) (24,007) Capital expenditures (112.999) (135.254) Net cash used in investing activities 5(292,479) $(357,369) Cash flows from financing activities Proceeds from exercise of stock options 74,597 24.216 Prepayment of acquired debt (21215) Not cash provided by financing activities $53,382 $24.216 Not increme in cash and cash equivalent 309,345 16.174 Cash and cash equivalents: Beginning of period 515,670 429.490 End of period 825.015 515,670 78,516 62.123 17.450 10.426 $337,956 (51,909) (121.632) $(173,541) 25,753 $25.753 190.168 230,328 429.490 2-Mar-2002 219.599 2.547 64.832 31.980 1.733 (147.268) 544 190 206 Exhibit 4: Statement of Cash Flows for Bed Bath & Beyond, FYE 2001-2003 ($ in thousands) 29 Feb-2004 1. Mar 2003 Cash flows from operating activities Net earnings 399.470 302.179 Adjustments to reconcile net camins to net cash provided by operating activities Depreciation and amortization 84,645 74,825 Amortization of bond premium 1.185 985 Tax benefit from exercise of stock options 31,176 Deferred income taxes (3.061) (13291) Increase) decrease in assets, net of effects of acquisitions: Merchandise nventories (27.058) (145789) Other current sets 12.055) (7.927 Other assets 5.466 Increme (decrease) habes, net of effects of acquisitions: Accounts payable 19.341 86,144 Accrued expenses and other current abilities 36,628 52,891 Income les payable (37.993) 20,378 Deferred rent and other lates 7.042 17.556 Not cash provided by operating activities $548.442 $419,317 Cash flows from investing activities Purchase of investment securities (361,013) (368,008) Redemption of investment securities 357.020 170,000 Payments for acquisitions, not of cash acquired (175.487) (24.007) Capital expenditures (112.00) (135.254) Net cash used in investing activities $(292.479) 5(357,350) Cash flows from financing activities Proceeds from exercise of stock options 74,607 24.216 Prepayment of acquired debt (21.215) Not cash provided by financing activities $53,382 $24.216 Not increase in cash and chequivalent 309.345 86.174 Cash and cash equivat Beginning of period 515,670 429 430 End of period 825,015 515,670 78,516 62.123 17.450 10.420 $337.056 (51.909) (121632) (173,541) 25,753 525.753 190,168 230,328 429.496 of 14 Exhibit 5: Excerpt from Bed Bath & Beyond's 2003 Annual Report Regarding Operating Leases The company cases retail stores, as well as warehouses, office facilities, and equipment, under agreements expiring at various dates through 2029. Certain Icases provide for contingent rents (which are based upon store sales exceeding stipulated amounts and are immaterial in fiscal 2003, 2002, and 2001), scheduled rent increases, and renewal options generally ranging from five to twenty years. The Company is obligated under a majority of the leases to pay for taxes, insurance, and common area maintenance charges. As of February 28, 2004, future minimum lease payments under noncancalable operating leases are as follows Fiscal Year Amount (in thousands) 2004 273,934 285,298 2005 2006 283,051 2007 274,325 2008 265,991 1,344,563 Thereafter Total future minimum lase payments 2.727,162 Expenses for all operating lases were $251.0 million $219.8 milion, and $1787 million for fiscal 2003, 2002, and 2001, respectively 22.8% Exhibit 6: Comparables Data for Bed Bath & Beyond (S in thousands except per share and ratio data)" Bed Bath & Williams Linens Beyond Sonora Things Target Kohl's JC Penney Best Buy Sales (5) 4,477,981 2,754,368 2,395,272 48,163,000 10,282,004 17,786,000 24.547,000 5yr CAGR 26.6% 18.9% 17.6% 9.5% -9.8% 19.5% EBIT (5) 639,343 254,787 121,953 3,519,000 1,023,304 750.000 1,304.000 EBIT margins 14.3% 9.3% 5.15 73% 100% 4.4% 5.3% Not income (5) 399.470 157.211 74,825 1.841,000 591.152 (928,000) 800.000 5yr CAGR 32.2% 23.4% 14.5% 14.5% 25.2% NA 29.9% Netmargins 8.9% 5.7% 3.8% 5.7% -5.2% 3.3% Return on common equity 20.1% 19.5% 9.8% 16.6% 14.1% -17.1% Annual dividends ( NIA NA NA 0.28 NIA 0.50 0.40 Syr CAGR NA NA NIA 70% NIA -27.4% NA Cash and equivalents 366.505 163,910 136,129 716,000 147,033 2.994.000 2,600,000 Accounts receivable 31,573 55,786 5,776,000 1.150.157 233.000 343.000 Inventory 1,012.334 404.100 701,020 5.343,000 1.606,000 3,156,000 2.607.000 PPRE.net 516,164 765,000 377.244 16,000,000 3.324 243 3,515,000 2.244.000 Total 2.5.023 1470,735 1,335,273 31.392.000 6,608,450 18,300,000 8.652.000 Total debe 37,377 11,063,000 1,088,502 5,374,000 850,000 Total liabilities 874205 666144 573,554 20,327.000 2.507,111 12,875,000 5.230.000 Shareholders equity 1,080,120 104,501 761,719 11,065,000 4.191,330 5,425,000 3,422,000 Market capitalization 12.171,014 3.699.885 1.595.834 40.420,163 16,089,477 9,517,079 16,92743 Interest expense (851) 1.045 550,000 75.240 261,000 NA EBIT interest coverage NIA NA 1167 63 13.6 3.0 NA Total debt to capital NA 0.0% 20.6% 49.8% 19.9% Bond rating NIA NA NA BB 38B- Bond rating last updated N/A NA 8/21/01 12/4/00 529103 6/21/01 2003 facel your ending 22:2004 br Bed and Beyond, 292004 for Wiams Sonoma, 73/2004 to Linens Things, UX2004 br Torpet 1012004 br Kohe and JCPenney, 229/2004 br Best Buy From 2003 annual report Coated wing Standard and Poor's Eat Worst Coverage formen Exhibit Castoldebt percentage of totalt and shareholder's quity Bond based on Standard and Poor's wing system. Moody's hodettings for each company SOON NA of 14 13.3 1.5 Exhibit 7A: Standard and Poor's Three-Year Median Key Industrial Financial Ratios, 2000-2002 AAA AA BBB BB EBIT interest coverage (*) 234 6.3 3.9 2.2 EBITDA interest coverage (*) 25.3 16.9 8.5 54 3.2 FFOotal debt (%) 214,2 65.7 42.2 30.6 19.7 10.4 Free operating cash flow/etal debt (%) 156.6 33.6 22.3 128 7.3 Return on capital (%) 35.0 26.6 18.1 13.1 11.5 8.0 Operating income/sales (%) 234 24.0 18.1 15,5 15.4 14.7 Long-term debUcapital (%) (1.1) 21.1 33.8 53.6 72.6 Total debt capital (%) 5.0 35.9 42.6 470 57.7 75.1 Number of companies 6 20 121 224 279 264 Average default rate, past 15 years 0.52% 1.31% 2.32% 6.64% 19.52% 35.76% Source: Standard & Poor's Based on the bonds original ratings 0.1 0.1 3.2 (28 1.2 8.8 78. 91.7 5 54,38% 40.3 Exhibit 8: Pro Forma 2003 Results for Alternative Capital Structures ($ in thousands) Actual 2003 Sales Operating profit Interest income 4,477,981 639,343 10,202 649,545 EBIT Pro Forma 2003 40% Debt To Total Capital $ 4,477,981 639,343 5,493 644,836 28,635 616,201 237,237 378,964 Interest expense Profit before taxes Taxes Profit after tax EPS-basic EPS-diluted 649,545 250.075 399,470 1.35 1.31 1.41 1.37 Average shares outstanding basic Average shares outstanding-diluted 296,854 304,690 268,845 276,681 166,595 466,595 636,328 1,036,328 954,492 1,990, 820 37.00 10.083,598 28,000 Cash and equivalents Total debt Total repurchase amount Shareholders' equity Common stock price (0/30/04) Market value of common stock Shares repurchased Proforma interest income and for reduction in cau balaca *Based on sede interest expension detta umed to be 43% Tax rate assumed to be 38.8%ed on actus 2003 results *Assumes for continues win poley of not paying duidends *Cash and events reduced by S400 million in ross cash Indudes excess cash and be Exhibit 9: Market Interest Rates-April 2004 Goverment Debt Interest Rates One-year Treasury bill Five-year Treasury note Ten-year Treasury bond 1.19% 2.79% 3.83% Corporate Bond Rates AAA AA A 5.33% 5.48% 5.75% 6.10% BBB Sowo DRI Beconomic
