

Question
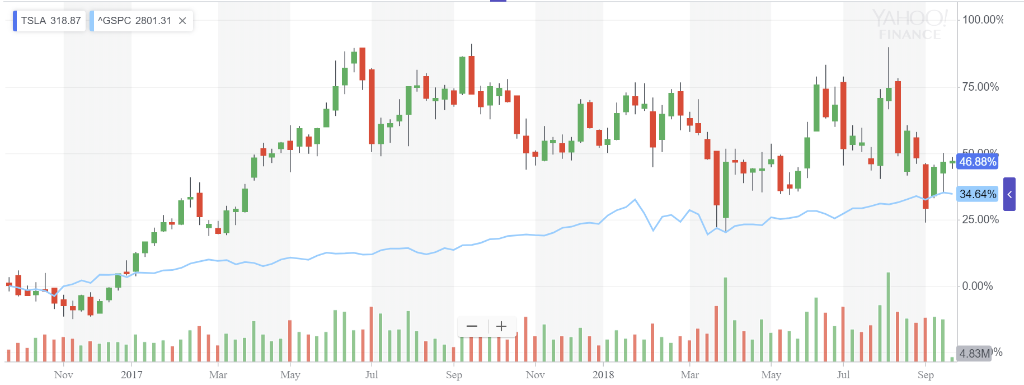
Please take a look at the attached picture. It shows Tesla stock price (ticker symbol: TSLA) over the last few years with S&P 500 index
Please take a look at the attached picture. It shows Tesla stock price (ticker symbol: TSLA) over the last few years with S&P 500 index (ticker symbol: ^GSPC) drawn in blue on top of the chart. As you can see the price of TSLA stock was several times more volatile than the price of S&P 500 index. However, many services (such as Yahoo! Finance (Links to an external site.)Links to an external site.) report that TSLA's beta is much less than 1.0 (we know that S&P 500 beta is equal to one by definition). In other words, beta tells us that TSLA is LESS volatile than the market while you clearly see in the picture that it is several times more volatile than the market (i.e. S&P 500).
Question: Suppose that Yahoo Finance is correct (and your eyes are also fine), how do you explain this discrepancy between the volatility visible on the chart and the relatively low beta given by the data providers such as Yahoo! Finance? Explain.
Step by Step Solution
There are 3 Steps involved in it
Step: 1

Get Instant Access to Expert-Tailored Solutions
See step-by-step solutions with expert insights and AI powered tools for academic success
Step: 2

Step: 3
Ace Your Homework with AI
Get the answers you need in no time with our AI-driven, step-by-step assistance
Get Started
Dividend Investing For Beginners Build Your Dividend Strategy Buy Dividend Stocks Easily And Achieve Lifelong Passive Income
Authors: G. R. Tiberius
1st Edition
B099TLJRT2, 979-8541466690