Answered step by step
Verified Expert Solution
Question
1 Approved Answer
please teach how to draw a graph after tax is imposed. please write the step in detail way so i can understand 8. Consider the

please teach how to draw a graph after tax is imposed. please write the step in detail way so i can understand
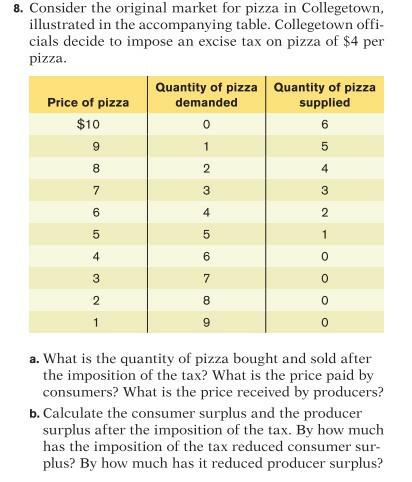
8. Consider the original market for pizza in Collegetown, illustrated in the accompanying table. Collegetown offi- cials decide to impose an excise tax on pizza of $4 per pizza. Price of pizza $10 9 Quantity of pizza Quantity of pizza demanded supplied 0 6 1 5 2 4 8 3 3 7 6 4 2 01 5 1 4 0 ON 3 7 0 2 00 0 1 9 9 a. What is the quantity of pizza bought and sold after the imposition of the tax? What is the price paid by consumers? What is the price received by producers? b. Calculate the consumer surplus and the producer surplus after the imposition of the tax. By how much has the imposition of the tax reduced consumer sur- plus? By how much has it reduced producer surplusStep by Step Solution
There are 3 Steps involved in it
Step: 1

Get Instant Access to Expert-Tailored Solutions
See step-by-step solutions with expert insights and AI powered tools for academic success
Step: 2

Step: 3

Ace Your Homework with AI
Get the answers you need in no time with our AI-driven, step-by-step assistance
Get Started


