Answered step by step
Verified Expert Solution
Question
1 Approved Answer
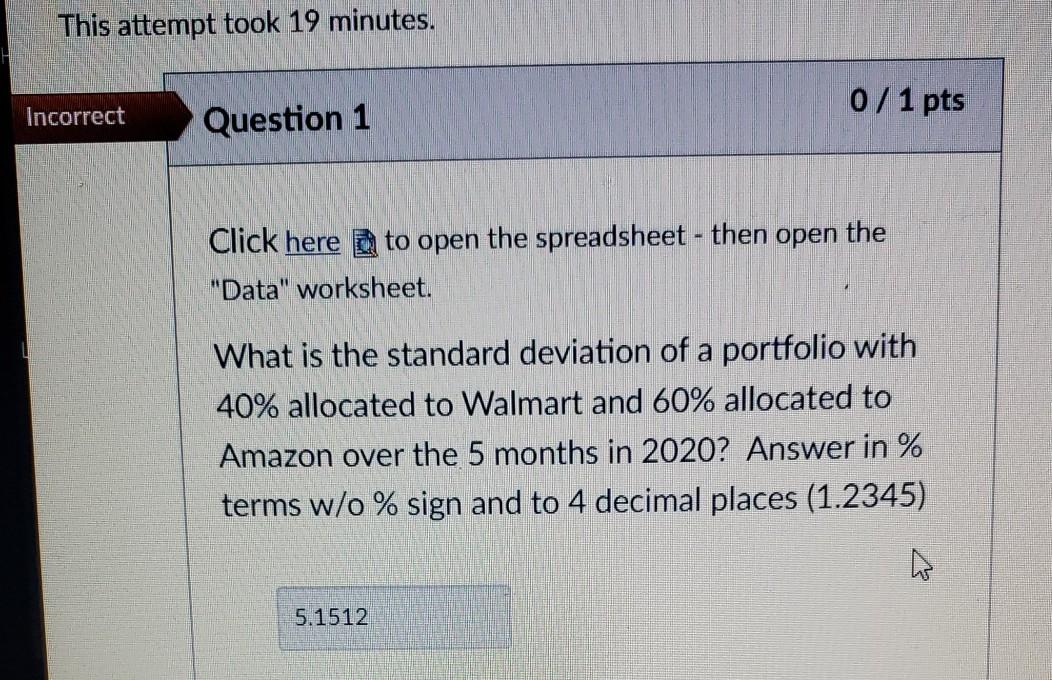
Please the answer has to be in 4 decimal places. Thanks. This attempt took 19 minutes. 0 / 1 pts Incorrect Question 1 Click here

Please the answer has to be in 4 decimal places. Thanks.
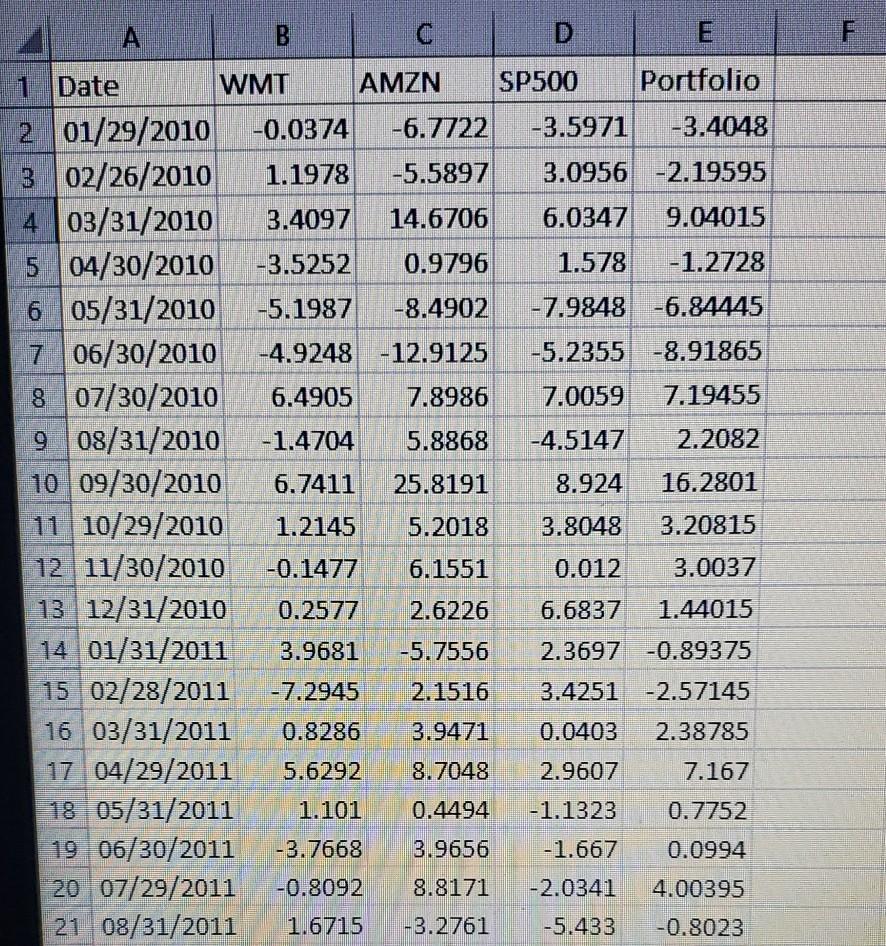
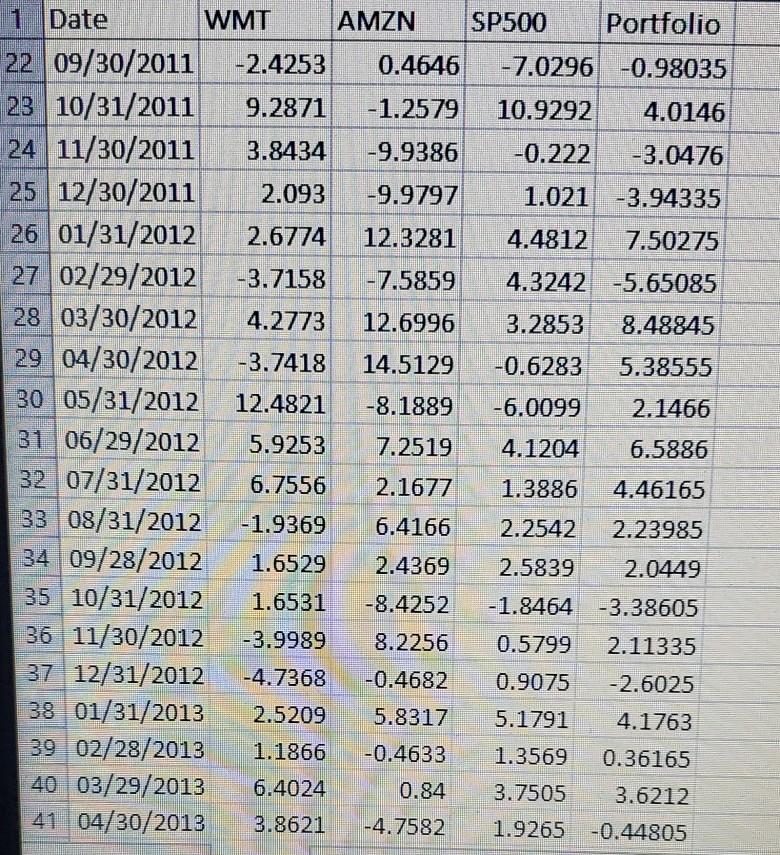
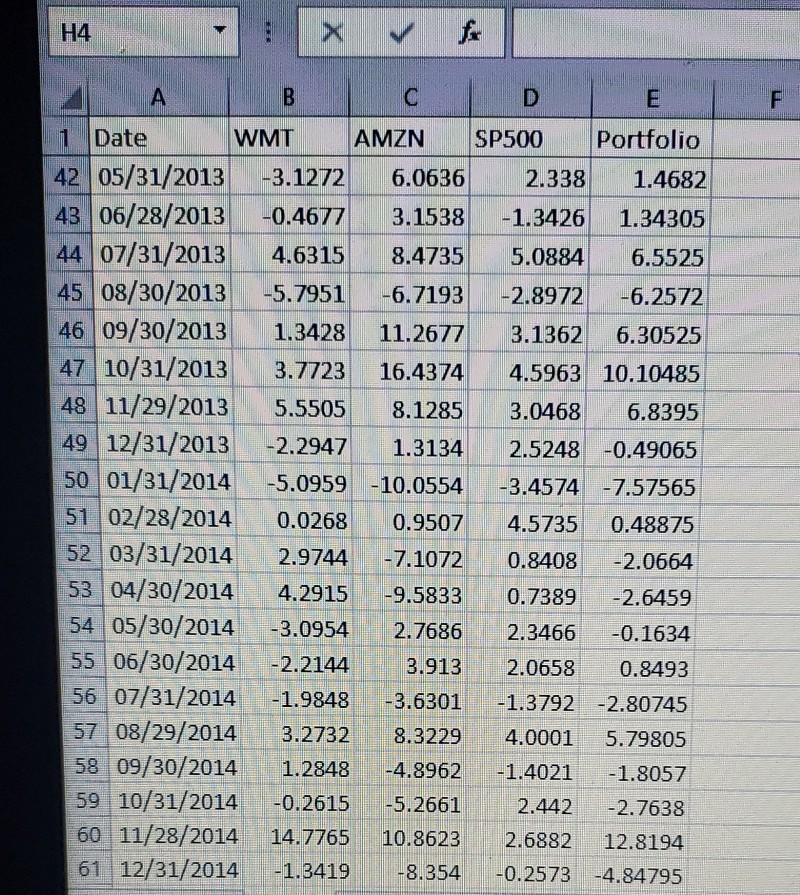
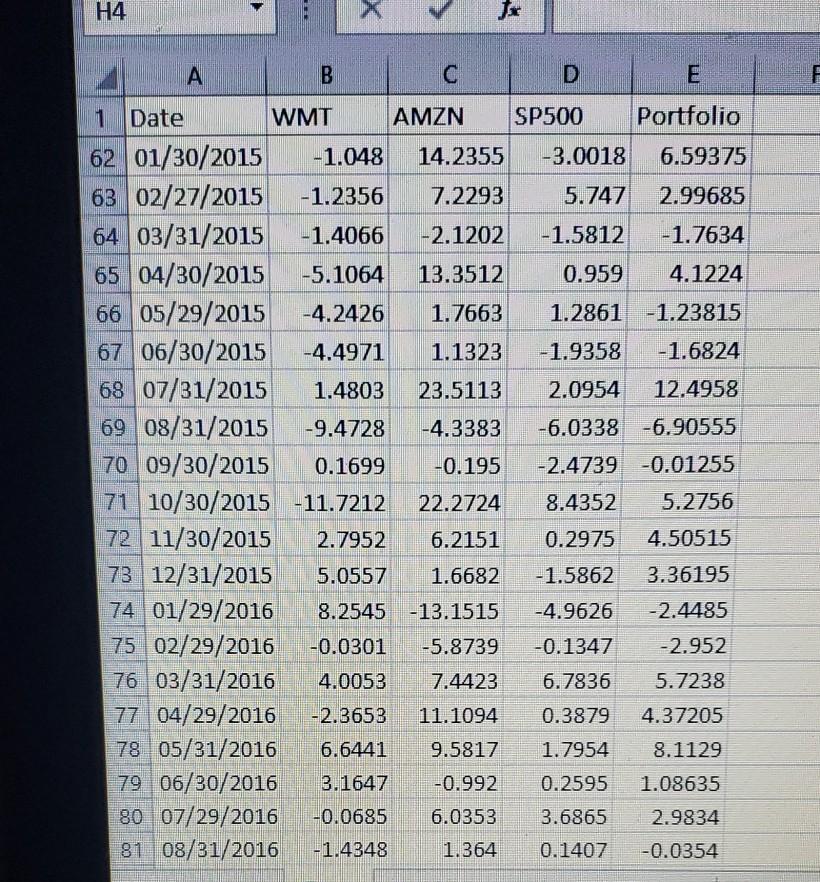
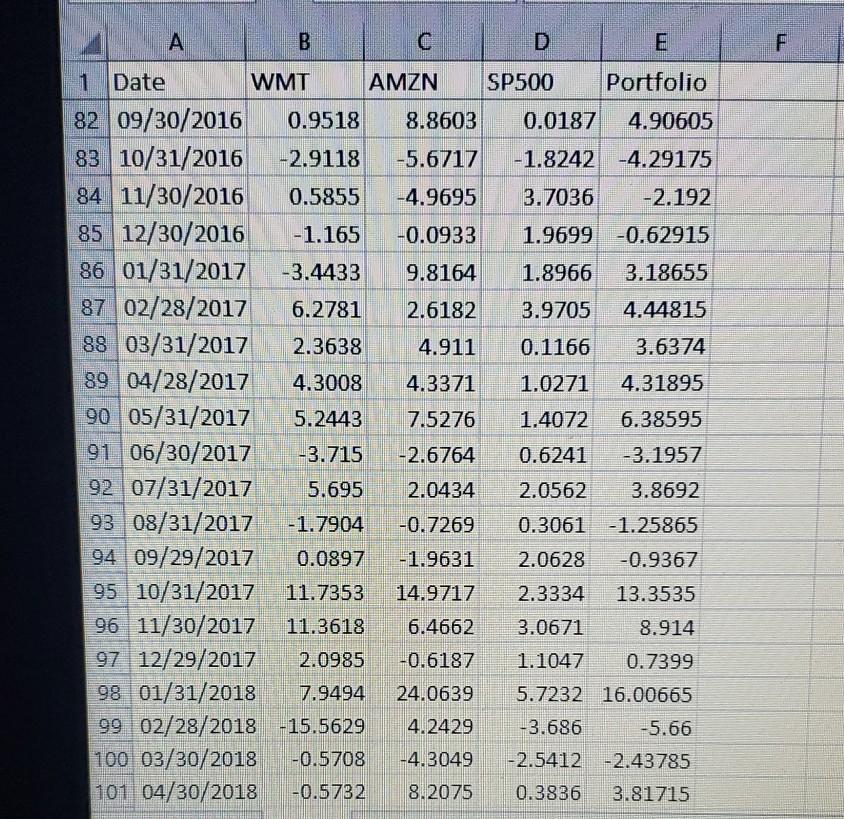
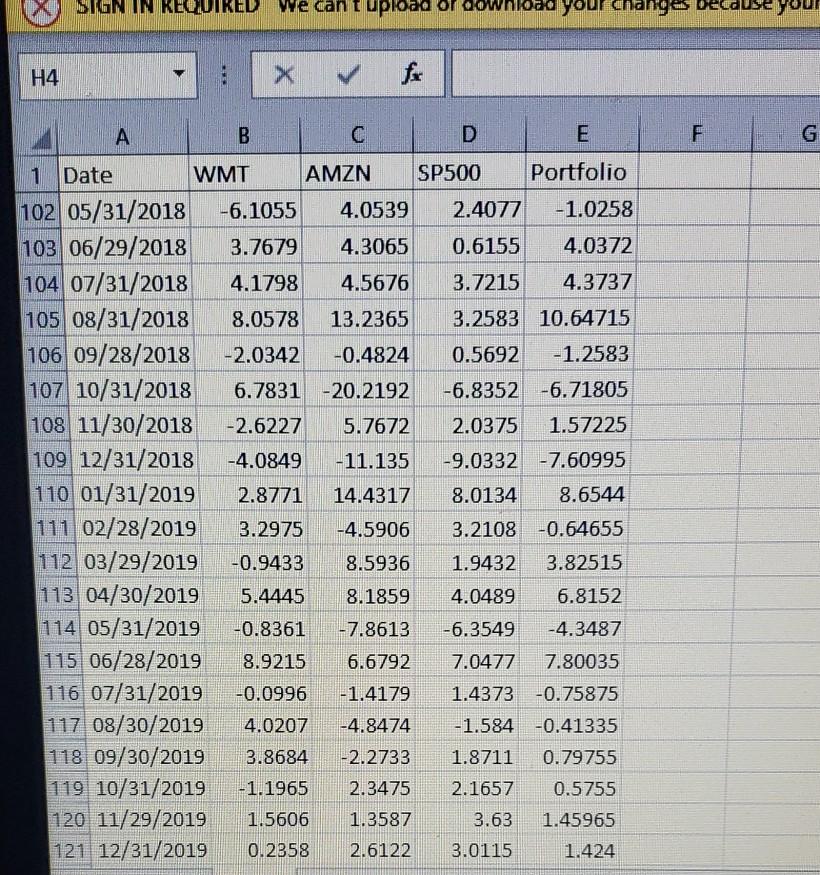
This attempt took 19 minutes. 0 / 1 pts Incorrect Question 1 Click here to open the spreadsheet - then open the "Data" worksheet. What is the standard deviation of a portfolio with 40% allocated to Walmart and 60% allocated to Amazon over the 5 months in 2020? Answer in % terms w/o % sign and to 4 decimal places (1.2345) 5.1512 B F 1 Date WMT AMZN SP500 Portfolio 2 01/29/2010 -0.0374 -6.7722 -3.5971 -3.4048 3 02/26/2010 1.1978 -5.5897 3.0956 -2.19595 4 03/31/2010 3.4097 14.6706 6.0347 9.04015 5 04/30/2010 -3.5252 0.9796 1.578 -1.2728 6 05/31/2010 -5.1987 -8.4902 -7.9848 -6.84445 7 7 06/30/2010 -4.9248 -12.9125 -5.2355 -8.91865 8 07/30/2010 6.4905 7.8986 7.0059 7.19455 9 08/31/2010 -1.4704 5.8868 -4.5147 2.2082 10 09/30/2010 6.7411 25.8191 8.924 16.2801 11 10/29/2010 1.2145 5.2018 3.8048 3.20815 12 11/30/2010 -0.1477 6.1551 0.012 3.0037 13 12/31/2010 0.2577 2.6226 6.6837 1.44015 14 01/31/2011 3.9681 -5.7556 2.3697 -0.89375 15 02/28/2011 -7.2945 2.1516 3.4251 -2.57145 16 03/31/2011 0.8286 3.9471 0.0403 2.38785 17 04/29/2011 5.6292 8.7048 2.9607 7.167 18 05/31/2011 1.101 0.4494 -1.1323 0.7752 19 06/30/2011 -3.7668 3.9656 -1.667 0.0994 20 07/29/2011 -0.8092 8.8171 -2.0341 4.00395 21 08/31/2011 1.6715 -3.2761 -5.433 -0.8023 1 Date WMT AMZN SP500 Portfolio 22 09/30/2011 -2.4253 0.4646 -7.0296 -0.98035 23 10/31/2011 9.2871 -1.2579 10.9292 4.0146 24 11/30/2011 3.8434 -9.9386 -0.222 -3.0476 25 12/30/2011 2.093 -9.9797 1.021 -3.94335 26 01/31/2012 2.6774 12.3281 4.4812 7.50275 27 02/29/2012 -3.7158 -7.5859 4.3242 -5.65085 28 03/30/2012 4.2773 12.6996 3.2853 8.48845 29 04/30/2012 -3.7418 14.5129 -0.6283 5.38555 30 05/31/2012 12.4821 -8.1889 -6.0099 2.1466 31 06/29/2012 5.9253 7.2519 4.1204 6.5886 32 07/31/2012 6.7556 2.1677 1.3886 4.46165 33 08/31/2012 -1.9369 6.4166 2.2542 2.23985 34 09/28/2012 1.6529 2.4369 2.5839 2.0449 35 10/31/2012 1.6531 -8.4252 -1.8464 -3.38605 36 11/30/2012 -3.9989 8.2256 0.5799 2.11335 37 12/31/2012 -4.7368 -0.4682 0.9075 -2.6025 38 01/31/2013 2.5209 5.8317 5.1791 4.1763 39 02/28/2013 1.1866 -0.4633 1.3569 0.36165 40 03/29/2013 6.4024 0.84 3.7505 3.6212 41 04/30/2013 3.8621 -4.7582 1.9265 -0.44805 H4 A B C D F 1 Date WMT AMZN SP500 Portfolio 42 05/31/2013 -3.1272 6.0636 2.338 1.4682 43 06/28/2013 -0.4677 3.1538 -1.3426 1.34305 44 07/31/2013 4.6315 8.4735 5.0884 6.5525 45 08/30/2013 -5.7951 -6.7193 -2.8972 -6.2572 46 09/30/2013 1.3428 11.2677 3.1362 6.30525 47 10/31/2013 3.7723 16.4374 4.5963 10.10485 48 11/29/2013 5.5505 8.1285 3.0468 6.8395 49 12/31/2013 -2.2947 1.3134 2.5248 -0.49065 50 01/31/2014 -5.0959 -10.0554 -3.4574 -7.57565 51 02/28/2014 0.0268 0.9507 4.5735 0.48875 52 03/31/2014 2.9744 -7.1072 0.8408 -2.0664 53 04/30/2014 4.2915 -9.5833 0.7389 -2.6459 54 05/30/2014 -3.0954 2.7686 2.3466 -0.1634 55 06/30/2014 - 2.2144 3.913 2.0658 0.8493 56 07/31/2014 -1.9848 -3.6301 -1.3792 -2.80745 57 08/29/2014 3.2732 8.3229 4.0001 5.79805 58 09/30/2014 1.2848 -4.8962 -1.4021 -1.8057 59 10/31/2014 -0.2615 -5.2661 2.442 -2.7638 60 11/28/2014 14.7765 10.8623 2.6882 12.8194 61 12/31/2014 -1.3419 -8.354 -0.2573 -4.84795 H4 X A B C D E 1 Date WMT AMZN SP500 Portfolio 62 01/30/2015 -1.048 14.2355 -3.0018 6.59375 63 02/27/2015 -1.2356 7.2293 5.747 2.99685 64 03/31/2015 -1.4066 -2.1202 -1.5812 -1.7634 65 04/30/2015 -5.1064 13.3512 0.959 4.1224 66 05/29/2015 -4.2426 1.7663 1.2861 -1.23815 67 06/30/2015 -4.4971 1.1323 -1.9358 -1.6824 68 07/31/2015 1.4803 23.5113 2.0954 12.4958 69 08/31/2015 -9.4728 -4.3383 -6.0338 -6.90555 70 09/30/2015 0.1699 -0.195 -2.4739 -0.01255 71 10/30/2015 -11.7212 22.2724 8.4352 5.2756 72 11/30/2015 2.7952 6.2151 0.2975 4.50515 73 12/31/2015 5.0557 1.6682 -1.5862 3.36195 74 01/29/2016 8.2545 -13.1515 -4.9626 -2.4485 75 02/29/2016 -0.0301 -5.8739 -0.1347 -2.952 76 03/31/2016 4.0053 7.4423 6.7836 5.7238 77 04/29/2016 -2.3653 11.1094 0.3879 4.37205 78 05/31/2016 6.6441 9.5817 1.7954 8.1129 79 06/30/2016 3.1647 -0.992 0.2595 1.08635 80 07/29/2016 -0.0685 6.0353 3.6865 2.9834 81 08/31/2016 -1.4348 1.364 0.1407 -0.0354 A B C F 1 Date WMT AMZN SP500 Portfolio 82 09/30/2016 0.9518 8.8603 0.0187 4.90605 83 10/31/2016 -2.9118 -5.6717 -1.8242 -4.29175 84 11/30/2016 0.5855 -4.9695 3.7036 -2.192 85 12/30/2016 -1.165 -0.0933 1.9699 -0.62915 86 01/31/2017 -3.4433 9.8164 1.8966 3.18655 87 02/28/2017 6.2781 2.6182 3.9705 4.44815 88 03/31/2017 2.3638 4.911 0.1166 3.6374 89 04/28/2017 4.3008 4.3371 1.0271 4.31895 90 05/31/2017 5.2443 7.5276 1.4072 6.38595 91 06/30/2017 -3.715 -2.6764 0.6241 -3.1957 92 07/31/2017 5.695 2.0434 2.0562 3.8692 93 08/31/2017 -1.7904 -0.7269 0.3061 -1.25865 94 09/29/2017 0.0897 -1.9631 2.0628 -0.9367 95 10/31/2017 11.7353 14.9717 2.3334 13.3535 96 11/30/2017 11.3618 6.4662 3.0671 8.914 97 12/29/2017 2.0985 -0.6187 1.1047 0.7399 98 01/31/2018 7.9494 24.0639 5.7232 16.00665 99 02/28/2018 -15.5629 4.2429 -3.686 -5.66 100 03/30/2018 -0.5708 -4.3049 -2.5412 -2.43785 101 04/30/2018 -0.5732 8.2075 0.3836 3.81715 IN IN ED we can I upload or download your change H4 X A B D E F G 1 Date WMT AMZN SP500 Portfolio 102 05/31/2018 -6.1055 4.0539 2.4077 -1.0258 103 06/29/2018 3.7679 4.3065 0.6155 4.0372 104 07/31/2018 4.1798 4.5676 3.7215 4.3737 105 08/31/2018 8.0578 13.2365 3.2583 10.64715 106 09/28/2018 -2.0342 -0.4824 0.5692 -1.2583 107 10/31/2018 6.7831 -20.2192 -6.8352 -6.71805 108 11/30/2018 -2.6227 5.7672 2.0375 1.57225 109 12/31/2018 -4.0849 -11.135 -9.0332 -7.60995 110 01/31/2019 2.8771 14.4317 8.0134 8.6544 111 02/28/2019 3.2975 -4.5906 3.2108 -0.64655 112 03/29/2019 -0.9433 8.5936 1.9432 3.82515 113 04/30/2019 5.4445 8.1859 4.0489 6.8152 114 05/31/2019 -0.8361 -7.8613 -6.3549 -4.3487 115 06/28/2019 8.9215 6.6792 7.0477 7.80035 116 07/31/2019 -0.0996 -1.4179 1.4373 -0.75875 117 08/30/2019 4.0207 -4.8474 -1.584 -0.41335 118 09/30/2019 3.8684 -2.2733 1.8711 0.79755 119 10/31/2019 -1.1965 2.3475 2.1657 0.5755 120 11/29/2019 1.5606 1.3587 3.63 1.45965 121 12/31/2019 0.2858 2.6122 3.0115 1.424 -3.6604 -5.9481 122 01/31/2020 123 02/28/2020 124 03/31/2020 125 04/30/2020 126 05/29/2020 5.9934 8.7064 -0.0439 2.523 -6.2214 -8.2321 -6.08475 3.5021 -12.3512 4.74775 26.89 12.8194 16.9347 -1.2785 4.763 0.61935 6.9794 2.5172 This attempt took 19 minutes. 0 / 1 pts Incorrect Question 1 Click here to open the spreadsheet - then open the "Data" worksheet. What is the standard deviation of a portfolio with 40% allocated to Walmart and 60% allocated to Amazon over the 5 months in 2020? Answer in % terms w/o % sign and to 4 decimal places (1.2345) 5.1512 B F 1 Date WMT AMZN SP500 Portfolio 2 01/29/2010 -0.0374 -6.7722 -3.5971 -3.4048 3 02/26/2010 1.1978 -5.5897 3.0956 -2.19595 4 03/31/2010 3.4097 14.6706 6.0347 9.04015 5 04/30/2010 -3.5252 0.9796 1.578 -1.2728 6 05/31/2010 -5.1987 -8.4902 -7.9848 -6.84445 7 7 06/30/2010 -4.9248 -12.9125 -5.2355 -8.91865 8 07/30/2010 6.4905 7.8986 7.0059 7.19455 9 08/31/2010 -1.4704 5.8868 -4.5147 2.2082 10 09/30/2010 6.7411 25.8191 8.924 16.2801 11 10/29/2010 1.2145 5.2018 3.8048 3.20815 12 11/30/2010 -0.1477 6.1551 0.012 3.0037 13 12/31/2010 0.2577 2.6226 6.6837 1.44015 14 01/31/2011 3.9681 -5.7556 2.3697 -0.89375 15 02/28/2011 -7.2945 2.1516 3.4251 -2.57145 16 03/31/2011 0.8286 3.9471 0.0403 2.38785 17 04/29/2011 5.6292 8.7048 2.9607 7.167 18 05/31/2011 1.101 0.4494 -1.1323 0.7752 19 06/30/2011 -3.7668 3.9656 -1.667 0.0994 20 07/29/2011 -0.8092 8.8171 -2.0341 4.00395 21 08/31/2011 1.6715 -3.2761 -5.433 -0.8023 1 Date WMT AMZN SP500 Portfolio 22 09/30/2011 -2.4253 0.4646 -7.0296 -0.98035 23 10/31/2011 9.2871 -1.2579 10.9292 4.0146 24 11/30/2011 3.8434 -9.9386 -0.222 -3.0476 25 12/30/2011 2.093 -9.9797 1.021 -3.94335 26 01/31/2012 2.6774 12.3281 4.4812 7.50275 27 02/29/2012 -3.7158 -7.5859 4.3242 -5.65085 28 03/30/2012 4.2773 12.6996 3.2853 8.48845 29 04/30/2012 -3.7418 14.5129 -0.6283 5.38555 30 05/31/2012 12.4821 -8.1889 -6.0099 2.1466 31 06/29/2012 5.9253 7.2519 4.1204 6.5886 32 07/31/2012 6.7556 2.1677 1.3886 4.46165 33 08/31/2012 -1.9369 6.4166 2.2542 2.23985 34 09/28/2012 1.6529 2.4369 2.5839 2.0449 35 10/31/2012 1.6531 -8.4252 -1.8464 -3.38605 36 11/30/2012 -3.9989 8.2256 0.5799 2.11335 37 12/31/2012 -4.7368 -0.4682 0.9075 -2.6025 38 01/31/2013 2.5209 5.8317 5.1791 4.1763 39 02/28/2013 1.1866 -0.4633 1.3569 0.36165 40 03/29/2013 6.4024 0.84 3.7505 3.6212 41 04/30/2013 3.8621 -4.7582 1.9265 -0.44805 H4 A B C D F 1 Date WMT AMZN SP500 Portfolio 42 05/31/2013 -3.1272 6.0636 2.338 1.4682 43 06/28/2013 -0.4677 3.1538 -1.3426 1.34305 44 07/31/2013 4.6315 8.4735 5.0884 6.5525 45 08/30/2013 -5.7951 -6.7193 -2.8972 -6.2572 46 09/30/2013 1.3428 11.2677 3.1362 6.30525 47 10/31/2013 3.7723 16.4374 4.5963 10.10485 48 11/29/2013 5.5505 8.1285 3.0468 6.8395 49 12/31/2013 -2.2947 1.3134 2.5248 -0.49065 50 01/31/2014 -5.0959 -10.0554 -3.4574 -7.57565 51 02/28/2014 0.0268 0.9507 4.5735 0.48875 52 03/31/2014 2.9744 -7.1072 0.8408 -2.0664 53 04/30/2014 4.2915 -9.5833 0.7389 -2.6459 54 05/30/2014 -3.0954 2.7686 2.3466 -0.1634 55 06/30/2014 - 2.2144 3.913 2.0658 0.8493 56 07/31/2014 -1.9848 -3.6301 -1.3792 -2.80745 57 08/29/2014 3.2732 8.3229 4.0001 5.79805 58 09/30/2014 1.2848 -4.8962 -1.4021 -1.8057 59 10/31/2014 -0.2615 -5.2661 2.442 -2.7638 60 11/28/2014 14.7765 10.8623 2.6882 12.8194 61 12/31/2014 -1.3419 -8.354 -0.2573 -4.84795 H4 X A B C D E 1 Date WMT AMZN SP500 Portfolio 62 01/30/2015 -1.048 14.2355 -3.0018 6.59375 63 02/27/2015 -1.2356 7.2293 5.747 2.99685 64 03/31/2015 -1.4066 -2.1202 -1.5812 -1.7634 65 04/30/2015 -5.1064 13.3512 0.959 4.1224 66 05/29/2015 -4.2426 1.7663 1.2861 -1.23815 67 06/30/2015 -4.4971 1.1323 -1.9358 -1.6824 68 07/31/2015 1.4803 23.5113 2.0954 12.4958 69 08/31/2015 -9.4728 -4.3383 -6.0338 -6.90555 70 09/30/2015 0.1699 -0.195 -2.4739 -0.01255 71 10/30/2015 -11.7212 22.2724 8.4352 5.2756 72 11/30/2015 2.7952 6.2151 0.2975 4.50515 73 12/31/2015 5.0557 1.6682 -1.5862 3.36195 74 01/29/2016 8.2545 -13.1515 -4.9626 -2.4485 75 02/29/2016 -0.0301 -5.8739 -0.1347 -2.952 76 03/31/2016 4.0053 7.4423 6.7836 5.7238 77 04/29/2016 -2.3653 11.1094 0.3879 4.37205 78 05/31/2016 6.6441 9.5817 1.7954 8.1129 79 06/30/2016 3.1647 -0.992 0.2595 1.08635 80 07/29/2016 -0.0685 6.0353 3.6865 2.9834 81 08/31/2016 -1.4348 1.364 0.1407 -0.0354 A B C F 1 Date WMT AMZN SP500 Portfolio 82 09/30/2016 0.9518 8.8603 0.0187 4.90605 83 10/31/2016 -2.9118 -5.6717 -1.8242 -4.29175 84 11/30/2016 0.5855 -4.9695 3.7036 -2.192 85 12/30/2016 -1.165 -0.0933 1.9699 -0.62915 86 01/31/2017 -3.4433 9.8164 1.8966 3.18655 87 02/28/2017 6.2781 2.6182 3.9705 4.44815 88 03/31/2017 2.3638 4.911 0.1166 3.6374 89 04/28/2017 4.3008 4.3371 1.0271 4.31895 90 05/31/2017 5.2443 7.5276 1.4072 6.38595 91 06/30/2017 -3.715 -2.6764 0.6241 -3.1957 92 07/31/2017 5.695 2.0434 2.0562 3.8692 93 08/31/2017 -1.7904 -0.7269 0.3061 -1.25865 94 09/29/2017 0.0897 -1.9631 2.0628 -0.9367 95 10/31/2017 11.7353 14.9717 2.3334 13.3535 96 11/30/2017 11.3618 6.4662 3.0671 8.914 97 12/29/2017 2.0985 -0.6187 1.1047 0.7399 98 01/31/2018 7.9494 24.0639 5.7232 16.00665 99 02/28/2018 -15.5629 4.2429 -3.686 -5.66 100 03/30/2018 -0.5708 -4.3049 -2.5412 -2.43785 101 04/30/2018 -0.5732 8.2075 0.3836 3.81715 IN IN ED we can I upload or download your change H4 X A B D E F G 1 Date WMT AMZN SP500 Portfolio 102 05/31/2018 -6.1055 4.0539 2.4077 -1.0258 103 06/29/2018 3.7679 4.3065 0.6155 4.0372 104 07/31/2018 4.1798 4.5676 3.7215 4.3737 105 08/31/2018 8.0578 13.2365 3.2583 10.64715 106 09/28/2018 -2.0342 -0.4824 0.5692 -1.2583 107 10/31/2018 6.7831 -20.2192 -6.8352 -6.71805 108 11/30/2018 -2.6227 5.7672 2.0375 1.57225 109 12/31/2018 -4.0849 -11.135 -9.0332 -7.60995 110 01/31/2019 2.8771 14.4317 8.0134 8.6544 111 02/28/2019 3.2975 -4.5906 3.2108 -0.64655 112 03/29/2019 -0.9433 8.5936 1.9432 3.82515 113 04/30/2019 5.4445 8.1859 4.0489 6.8152 114 05/31/2019 -0.8361 -7.8613 -6.3549 -4.3487 115 06/28/2019 8.9215 6.6792 7.0477 7.80035 116 07/31/2019 -0.0996 -1.4179 1.4373 -0.75875 117 08/30/2019 4.0207 -4.8474 -1.584 -0.41335 118 09/30/2019 3.8684 -2.2733 1.8711 0.79755 119 10/31/2019 -1.1965 2.3475 2.1657 0.5755 120 11/29/2019 1.5606 1.3587 3.63 1.45965 121 12/31/2019 0.2858 2.6122 3.0115 1.424 -3.6604 -5.9481 122 01/31/2020 123 02/28/2020 124 03/31/2020 125 04/30/2020 126 05/29/2020 5.9934 8.7064 -0.0439 2.523 -6.2214 -8.2321 -6.08475 3.5021 -12.3512 4.74775 26.89 12.8194 16.9347 -1.2785 4.763 0.61935 6.9794 2.5172Step by Step Solution
There are 3 Steps involved in it
Step: 1

Get Instant Access to Expert-Tailored Solutions
See step-by-step solutions with expert insights and AI powered tools for academic success
Step: 2

Step: 3

Ace Your Homework with AI
Get the answers you need in no time with our AI-driven, step-by-step assistance
Get Started


