Answered step by step
Verified Expert Solution
Question
1 Approved Answer
Please type your responses below each question. Round your answers to one decimal point. Remember to show all work and to double-check the units.


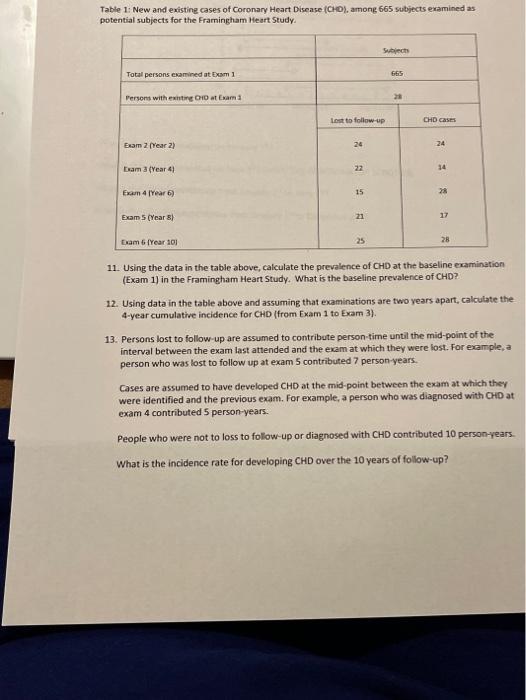
Please type your responses below each question. Round your answers to one decimal point. Remember to show all work and to double-check the units. This workshop must be submitted on Moodle as doc by Friday, August 27 at 10 am. Submit the file as workshop1_YOURLASTNAME.doc. Scratch paper can be scanned and submitted as scratch1 YOURLASTNAME.pdf (or applicable file). Exercise 1: The figure below represents ten episodes of an illness in a total population of 25 over a period of 12 months. Each horizontal line represents the portion of time one person spends being ill. The line begins on the date of onset (J) and ends on the date of death (+) or recovery (). The vertical dashed lines represent three dates, where anything to the left happened before that date and anything to the right happened after that date. P & 01/01/18 off Date of every o o o 06/01/18 + 12/31/18 1. What is the point prevalence on January 1"? 2. What is the point prevalence on June 1"? (HINT: THE DENOMINATOR IS NOT 25) 3. What is the period prevalence from January 1" to June 1"? 4. What is the cumulative incidence from January 1" to December 31"? Table 1: New and existing cases of Coronary Heart Disease (CHD), among 665 subjects examined as potential subjects for the Framingham Heart Study. Total persons examined at Exam 1 Persons with existing CHD at Exam 1 Exam 2 (Year 2) Exam 3 (Year 4) Exam 4 (Year 6) Exam 5 (Year 8) Exam 6 (Year 10) Lost to follow-up 24 22 15 21 Subjects 25 665 28 CHD cases 24 34 28 17 28 11. Using the data in the table above, calculate the prevalence of CHD at the baseline examination (Exam 1) in the Framingham Heart Study. What is the baseline prevalence of CHD? 12. Using data in the table above and assuming that examinations are two years apart, calculate the 4-year cumulative incidence for CHD (from Exam 1 to Exam 3). 13. Persons lost to follow-up are assumed to contribute person-time until the mid-point of the interval between the exam last attended and the exam at which they were lost. For example, a person who was lost to follow up at exam 5 contributed 7 person-years. Cases are assumed to have developed CHD at the mid-point between the exam at which they were identified and the previous exam. For example, a person who was diagnosed with CHD at exam 4 contributed 5 person-years. People who were not loss to follow-up or diagnosed with CHD contributed 10 person-years. What is the incidence rate for developing CHD over the 10 years of follow-up?
Step by Step Solution
★★★★★
3.40 Rating (162 Votes )
There are 3 Steps involved in it
Step: 1
Exercise 1 1 What is the point prevalence on January 1 Total population on 1118 25 Number of people ...
Get Instant Access to Expert-Tailored Solutions
See step-by-step solutions with expert insights and AI powered tools for academic success
Step: 2

Step: 3

Ace Your Homework with AI
Get the answers you need in no time with our AI-driven, step-by-step assistance
Get Started


