Answered step by step
Verified Expert Solution
Question
1 Approved Answer
Please use a programming language to plot results! For a signal: Derive the expression for the total energy if: , where T is the time
Please use a programming language to plot results! 

 ,
, 
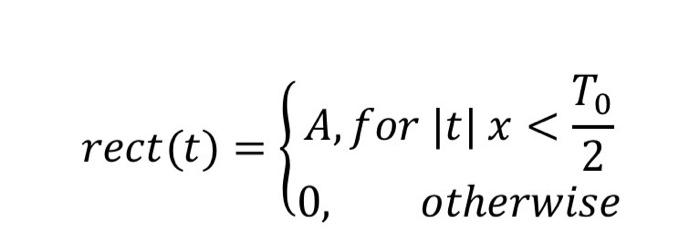
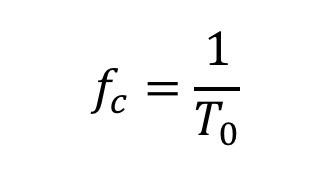
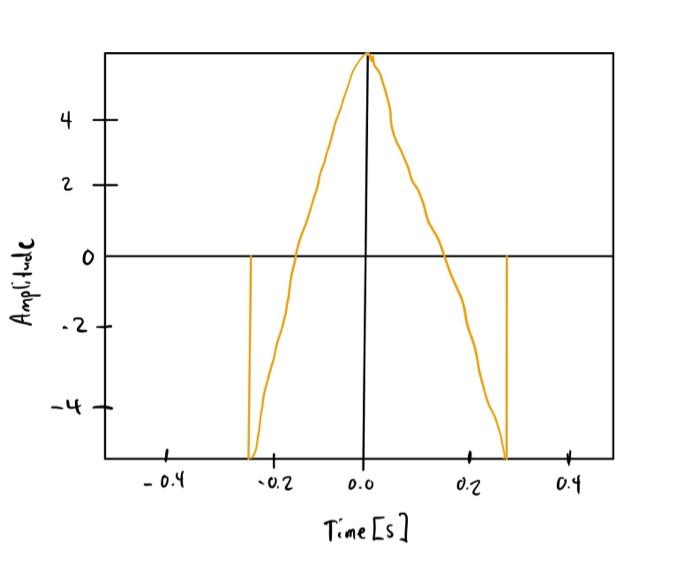
g(t) = rect(t) cos(21fct)where rect(t) To A, for tx 2 (0, otherwise 1 fc II To 4 4 2 o Amplitude .2 -4 -0.4 -0.2 0.0 0.2 0.4 Time [s] For a signal:


Derive the expression for the total energy if:
 ,
,where T is the time period of the rectangular pulse, and fc is the frequency of the cosine wave.
Plot the energy spectral density of g(t) in the frequency domain. Using the above expression, calculate the value of the total energy if A = 5.0, and T0 = 0.5s.
Is this value same as the peak value of the energy spectral density of g(t) plotted in the frequency domain? If not, what is the relationship between them?

Step by Step Solution
There are 3 Steps involved in it
Step: 1

Get Instant Access to Expert-Tailored Solutions
See step-by-step solutions with expert insights and AI powered tools for academic success
Step: 2

Step: 3

Ace Your Homework with AI
Get the answers you need in no time with our AI-driven, step-by-step assistance
Get Started


