please use an excel document and also show what equations are used!
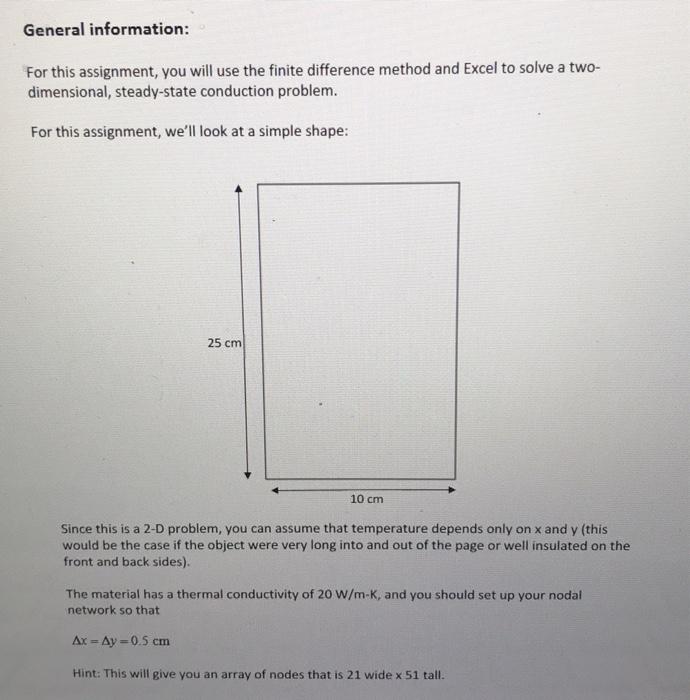
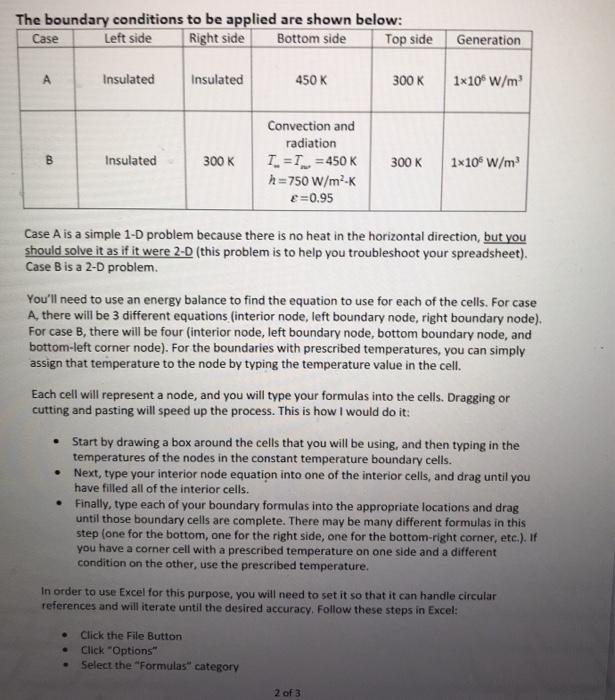
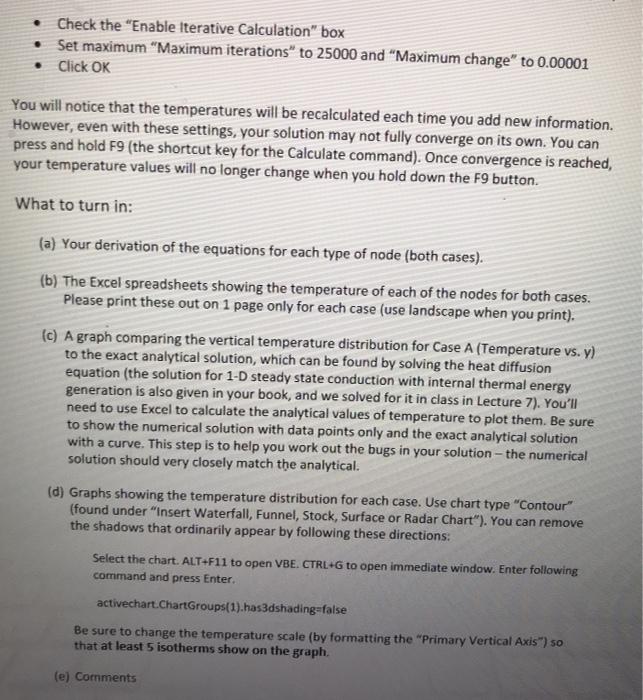
General information: For this assignment, you will use the finite difference method and Excel to solve a two- dimensional, steady-state conduction problem. For this assignment, we'll look at a simple shape: 25 cm 10 cm Since this is a 2-D problem, you can assume that temperature depends only on x and y (this would be the case if the object were very long into and out of the page or well insulated on the front and back sides). The material has a thermal conductivity of 20 W/m-K, and you should set up your nodal network so that Ax = Ay=0.5 cm Hint: This will give you an array of nodes that is 21 wide x 51 tall. The boundary conditions to be applied are shown below: Case Left side Right side Bottom side Top side Generation A Insulated Insulated 450 K 300K 1x10 W/m B Insulated 300K Convection and radiation I=T=450 K h=750 W/m2K E=0.95 300 K 1x10 W/m Case A is a simple 1-D problem because there is no heat in the horizontal direction, but you should solve it as if it were 2-D (this problem is to help you troubleshoot your spreadsheet). Case B is a 2-D problem. You'll need to use an energy balance to find the equation to use for each of the cells. For case A, there will be 3 different equations (interior node, left boundary node, right boundary node). For case B, there will be four (interior node, left boundary node, bottom boundary node, and bottom-left corner node). For the boundaries with prescribed temperatures, you can simply assign that temperature to the node by typing the temperature value in the cell. Each cell will represent a node, and you will type your formulas into the celis. Dragging or cutting and pasting will speed up the process. This is how I would do it: Start by drawing a box around the cells that you will be using, and then typing in the temperatures of the nodes in the constant temperature boundary cells. Next, type your interior node equation into one of the interior cells, and drag until you have filled all of the interior cells. Finally, type each of your boundary formulas into the appropriate locations and drag until those boundary cells are complete. There may be many different formulas in this step (one for the bottom, one for the right side, one for the bottom-right corner, etc.). If you have a corner cell with a prescribed temperature on one side and a different condition on the other, use the prescribed temperature. In order to use Excel for this purpose, you will need to set it so that it can handle circular references and williterate until the desired accuracy. Follow these steps in Excel: Click the File Button Click "Options" Select the "Formulas category 2 of 3 Check the "Enable iterative Calculation" box Set maximum "Maximum iterations" to 25000 and "Maximum change to 0.00001 Click OK . You will notice that the temperatures will be recalculated each time you add new information. However, even with these settings, your solution may not fully converge on its own. You can press and hold F9 (the shortcut key for the Calculate command). Once convergence is reached, your temperature values will no longer change when you hold down the F9 button. What to turn in: (a) Your derivation of the equations for each type of node (both cases). (b) The Excel spreadsheets showing the temperature of each of the nodes for both cases. Please print these out on 1 page only for each case (use landscape when you print). (c) A graph comparing the vertical temperature distribution for Case A (Temperature vs. y) to the exact analytical solution, which can be found by solving the heat diffusion equation (the solution for 1-D steady state conduction with internal thermal energy generation is also given in your book, and we solved for it in class in Lecture 7). You'll need to use Excel to calculate the analytical values of temperature to plot them. Be sure to show the numerical solution with data points only and the exact analytical solution with a curve. This step is to help you work out the bugs in your solution - the numerical solution should very closely match the analytical. (d) Graphs showing the temperature distribution for each case. Use chart type "Contour" (found under "Insert Waterfall, Funnel, Stock, Surface or Radar Chart"). You can remove the shadows that ordinarily appear by following these directions: Select the chart. ALT+F11 to open VBE. CTRL+G to open immediate window. Enter following command and press Enter activechart.ChartGroups(1). has3dshading=false Be sure to change the temperature scale (by formatting the "Primary Vertical Axis") so that at least 5 isotherms show on the graph. (e) Comments General information: For this assignment, you will use the finite difference method and Excel to solve a two- dimensional, steady-state conduction problem. For this assignment, we'll look at a simple shape: 25 cm 10 cm Since this is a 2-D problem, you can assume that temperature depends only on x and y (this would be the case if the object were very long into and out of the page or well insulated on the front and back sides). The material has a thermal conductivity of 20 W/m-K, and you should set up your nodal network so that Ax = Ay=0.5 cm Hint: This will give you an array of nodes that is 21 wide x 51 tall. The boundary conditions to be applied are shown below: Case Left side Right side Bottom side Top side Generation A Insulated Insulated 450 K 300K 1x10 W/m B Insulated 300K Convection and radiation I=T=450 K h=750 W/m2K E=0.95 300 K 1x10 W/m Case A is a simple 1-D problem because there is no heat in the horizontal direction, but you should solve it as if it were 2-D (this problem is to help you troubleshoot your spreadsheet). Case B is a 2-D problem. You'll need to use an energy balance to find the equation to use for each of the cells. For case A, there will be 3 different equations (interior node, left boundary node, right boundary node). For case B, there will be four (interior node, left boundary node, bottom boundary node, and bottom-left corner node). For the boundaries with prescribed temperatures, you can simply assign that temperature to the node by typing the temperature value in the cell. Each cell will represent a node, and you will type your formulas into the celis. Dragging or cutting and pasting will speed up the process. This is how I would do it: Start by drawing a box around the cells that you will be using, and then typing in the temperatures of the nodes in the constant temperature boundary cells. Next, type your interior node equation into one of the interior cells, and drag until you have filled all of the interior cells. Finally, type each of your boundary formulas into the appropriate locations and drag until those boundary cells are complete. There may be many different formulas in this step (one for the bottom, one for the right side, one for the bottom-right corner, etc.). If you have a corner cell with a prescribed temperature on one side and a different condition on the other, use the prescribed temperature. In order to use Excel for this purpose, you will need to set it so that it can handle circular references and williterate until the desired accuracy. Follow these steps in Excel: Click the File Button Click "Options" Select the "Formulas category 2 of 3 Check the "Enable iterative Calculation" box Set maximum "Maximum iterations" to 25000 and "Maximum change to 0.00001 Click OK . You will notice that the temperatures will be recalculated each time you add new information. However, even with these settings, your solution may not fully converge on its own. You can press and hold F9 (the shortcut key for the Calculate command). Once convergence is reached, your temperature values will no longer change when you hold down the F9 button. What to turn in: (a) Your derivation of the equations for each type of node (both cases). (b) The Excel spreadsheets showing the temperature of each of the nodes for both cases. Please print these out on 1 page only for each case (use landscape when you print). (c) A graph comparing the vertical temperature distribution for Case A (Temperature vs. y) to the exact analytical solution, which can be found by solving the heat diffusion equation (the solution for 1-D steady state conduction with internal thermal energy generation is also given in your book, and we solved for it in class in Lecture 7). You'll need to use Excel to calculate the analytical values of temperature to plot them. Be sure to show the numerical solution with data points only and the exact analytical solution with a curve. This step is to help you work out the bugs in your solution - the numerical solution should very closely match the analytical. (d) Graphs showing the temperature distribution for each case. Use chart type "Contour" (found under "Insert Waterfall, Funnel, Stock, Surface or Radar Chart"). You can remove the shadows that ordinarily appear by following these directions: Select the chart. ALT+F11 to open VBE. CTRL+G to open immediate window. Enter following command and press Enter activechart.ChartGroups(1). has3dshading=false Be sure to change the temperature scale (by formatting the "Primary Vertical Axis") so that at least 5 isotherms show on the graph. (e) Comments