Answered step by step
Verified Expert Solution
Question
1 Approved Answer
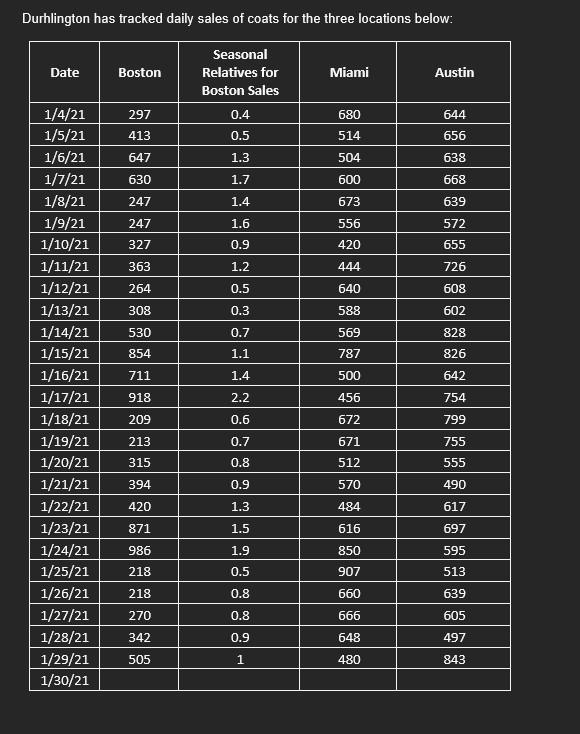
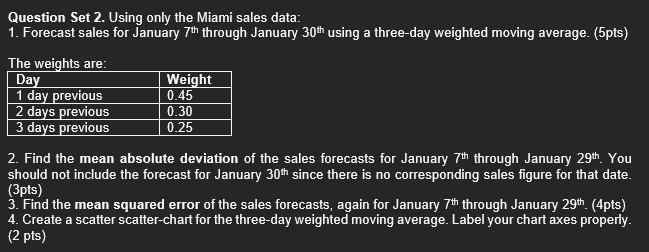
PLEASE USE EXCEL AND SHOW FORMULAS Durhlington has tracked daily sales of coats for the three locations below: Question Set 2. Using only the Miami


PLEASE USE EXCEL AND SHOW FORMULAS
Durhlington has tracked daily sales of coats for the three locations below: Question Set 2. Using only the Miami sales data: 1. Forecast sales for January 7th through January 30th using a three-day weighted moving average. (5pts) The weiohts are: 2. Find the mean absolute deviation of the sales forecasts for January 7th through January 29th. You should not include the forecast for January 30th since there is no corresponding sales figure for that date. (3pts) 3. Find the mean squared error of the sales forecasts, again for January 7th through January 29th. (4pts) 4. Create a scatter scatter-chart for the three-day weighted moving average. Label your chart axes properly. (2 pts)Step by Step Solution
There are 3 Steps involved in it
Step: 1

Get Instant Access to Expert-Tailored Solutions
See step-by-step solutions with expert insights and AI powered tools for academic success
Step: 2

Step: 3

Ace Your Homework with AI
Get the answers you need in no time with our AI-driven, step-by-step assistance
Get Started


