

Question
Please use excel and show the excel formulas so I can understand. Please include the rows and columns in your picture so I can follow
Please use excel and show the excel formulas so I can understand. Please include the rows and columns in your picture so I can follow along. I'll make sure to thumbs up.
Here are the previous values: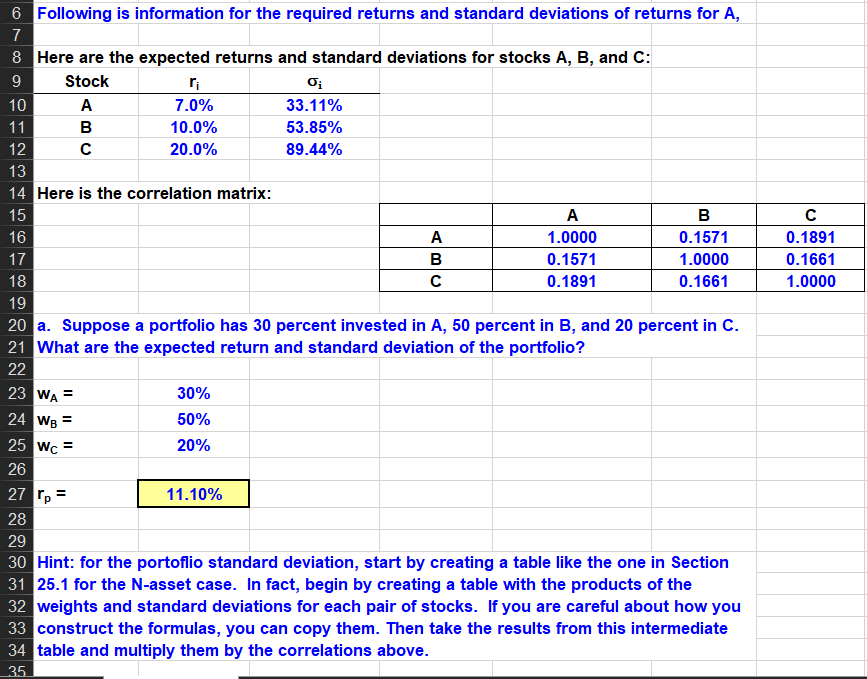 Thank you!
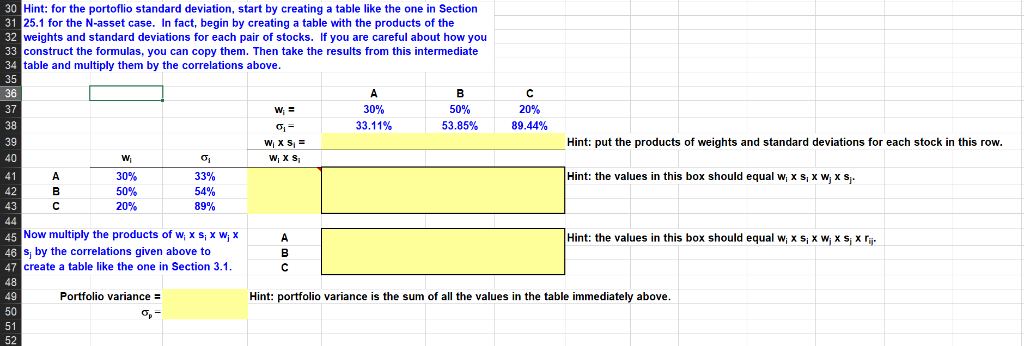
Hint: for the portoflio standard deviation, start by creating a table like the one in Section 25.1 for the N-asset case. In fact, begin by creating a table with the products of the weights and standard deviations for each pair of stocks. If you are careful about how you construct the formulas, you can copy them. Then take the results from this intermediate table and multiply them by the correlations above 32 34 37 38 39 33.11% 53.85% 89.44% Hint: put the products of weights and standard deviations for each stock in this row. W X Si 33% 54% 89% Hint: the values in this box should equal w, x s,x w, x S. 50% Now multiply the products of w, x s, x w, x s, by the correlations given above to create a table like the one in Section 3.1 Hint: the values in this box should equal w, XSxW x S x r Portfolio variance E Hint: portfolio variance is the sum of al the values in the table immediately above 52 Following is information for the required returns and standard deviations of returns for A, Here are the expected returns and standard deviations for stocks A, B, and C: Stock 7.0% 10.0% 20.0% 33.11% 53.85% 89.44% Here is the correlation matrix 1.0000 0.1571 0.1891 0.1571 1.0000 0.1661 0.1891 0.1661 1.0000 20 a. Suppose a portfolio has 30 percent invested in A, 50 percent in B, and 20 percent in C What are the expected return and standard deviation of the portfolio? 23 24 25 30% 50% 20% WA Wc- 27 28 11.10% Hint: for the portoflio standard deviation, start by creating a table like the one in Section 25.1 for the N-asset case. In fact, begin by creating a table with the products of the weights and standard deviations for each pair of stocks. If you are careful about how you 3 construct the formulas, you can copy them. Then take the results from this intermediate table and multiply them by the correlations above
Step by Step Solution
There are 3 Steps involved in it
Step: 1

Get Instant Access to Expert-Tailored Solutions
See step-by-step solutions with expert insights and AI powered tools for academic success
Step: 2

Step: 3
Ace Your Homework with AI
Get the answers you need in no time with our AI-driven, step-by-step assistance
Get Started
Passive Income The Passive Income Millionaire
Authors: Alexus Arellano
1st Edition
9814950882, 978-9814950886