

Answered step by step
Verified Expert Solution
Question
1 Approved Answer
Please use excel in answering this problems. Thank you ^_^ 1. Using the table below. Compute the NPV of the Optimistic and Pessimistic scenario and
Please use excel in answering this problems. Thank you ^_^
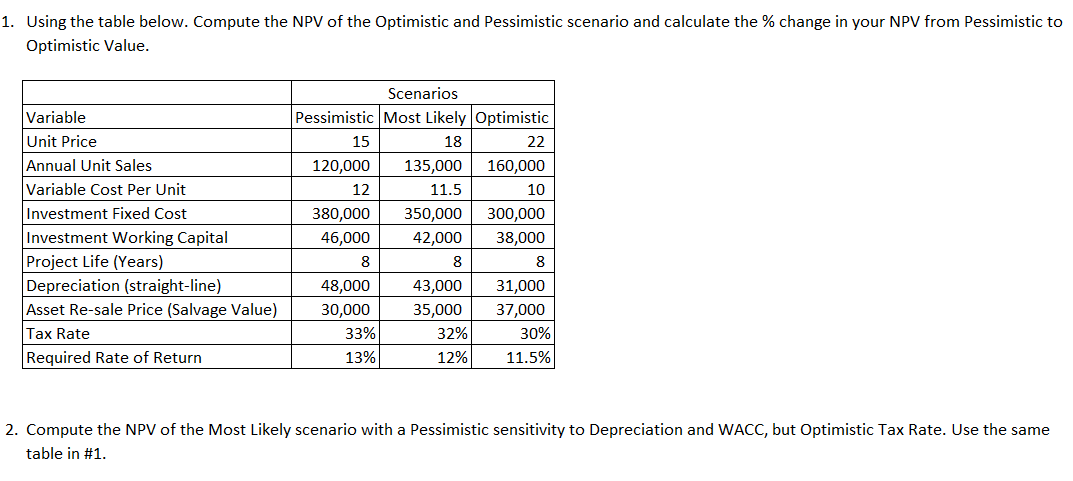
1. Using the table below. Compute the NPV of the Optimistic and Pessimistic scenario and calculate the % change in your NPV from Pessimistic to Optimistic Value. Scenarios Variable Pessimistic Most Likely Optimistic Unit Price 15 18 22 120,000 135,000 160,000 12 11.5 10 380,000 350,000 300,000 38,000 46,000 42,000 Annual Unit Sales Variable Cost Per Unit Investment Fixed Cost Investment Working Capital Project Life (Years) Depreciation (straight-line) Asset Re-sale Price (Salvage Value) Tax Rate Required Rate of Return 8 8 8 48,000 43,000 31,000 37,000 30,000 33% 35,000 32% 30% 13% 12% 11.5% 2. Compute the NPV of the Most Likely scenario with a Pessimistic sensitivity to Depreciation and WACC, but Optimistic Tax Rate. Use the same table in #1Step by Step Solution
There are 3 Steps involved in it
Step: 1

Get Instant Access to Expert-Tailored Solutions
See step-by-step solutions with expert insights and AI powered tools for academic success
Step: 2

Step: 3
Ace Your Homework with AI
Get the answers you need in no time with our AI-driven, step-by-step assistance
Get Started
Futures Trading Demystified
Authors: Silas Walsh
1st Edition
979-8859505005