please use excel, show formula sheet and values sheet

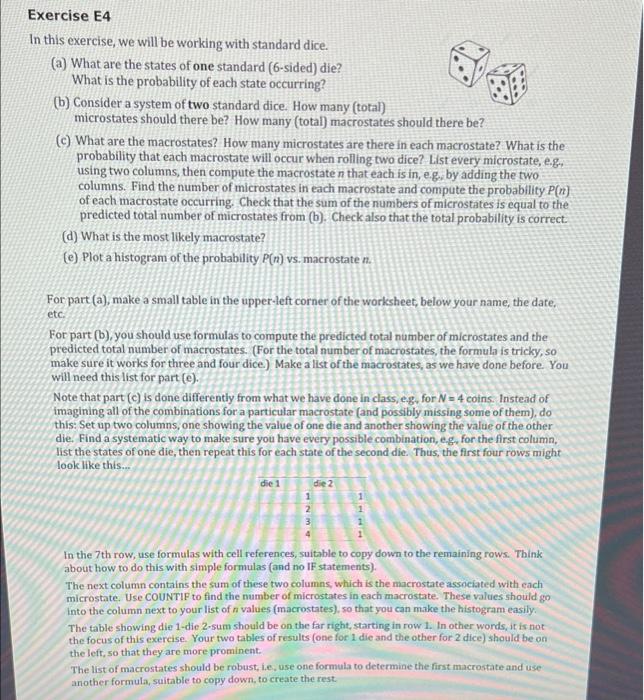
Exercise E4 In this exercise, we will be working with standard dice. (a) What are the states of one standard (6-sided) die? What is the probability of each state occurring? (b) Consider a system of two standard dice. How many (total) microstates should there be? How many (total) macrostates should there be? (c) What are the macrostates? How many microstates are there in each macrostate? What is the probability that each macrostate will occur when rolling two dice? List every microstate, e.ge using two columns, then compute the macrostate n that each is in, e.g, by adding the two columns. Find the number of microstates in each macrostate and compute the probability P(1) of each macrostate occurring. Check that the sum of the numbers of microstates is equal to the predicted total number of microstates from (b). Check also that the total probability is correct. (d) What is the most likely macrostate? (e) Plot a histogram of the probability P(n) vs. macrostate n. For part (a), make a small table in the upper-left corner of the worksheet, below your name, the date, etc. For part (b), you should use formulas to compute the predicted total number of microstates and the predicted total number of macrostates. (For the total number of macrostates, the formula is tricky, so make sure it works for three and four dice) Make a list of the macrostates, as we have done before. You will need this list for part (e). Note that part() is done differently from what we have done in class, eg, for N = 4 coins. Instead of imagining all of the combinations for a particular macrostate (and possibly missing some of them), do this: Set up two columns, one showing the value of one die and another showing the value of the other die. Find a systematic way to make sure you have every possible combination, eg, for the first column. list the states of one die, then repeat this for each state of the second die. Thus, the first four rows might look like this... die 1 die 2 1 2 2 In the 7th row, use formulas with cell references, suitable to copy down to the remaining rows. Think about how to do this with simple formulas (and no IF statements). The next column contains the sum of these two columns which is the macrostate associated with each microstate. Use COUNTIF to find the number of microstates in each macrostate. These values should go into the column next to your list of n values (macrostates), so that you can make the histogram easily. The table showing die 1-die 2-sum should be on the far right, starting in row 1. In other words, it is not the focus of this exercise. Your two tables of results (one for 1 die and the other for 2 dice) should be on the left, so that they are more prominent. The list of macrostates should be robust, ie, use one formula to determine the first macrostate and use another formula, suitable to copy down, to create the rest


