PLEASE USE EXCEL SPREADSHEET AND EXCEL FORMULAS AND EXPLAIN THE PROCESS WITH CALCULATIONS. THIS IS MY THIRD TIME POSTING THE SAME QUESTION AND I HAVE NOT BEEN RECEIEVING A PROPER ANSWER. IF THE ANSWER IS NOT IN EXCEL AND IS WITHOUT FORMULAS AND CALCULATIONS FOR BOTH QUESTION SETS. I HAVE NO CHOICE BUT TO GIVE A NEGATIVE LIKE. THANK YOU!


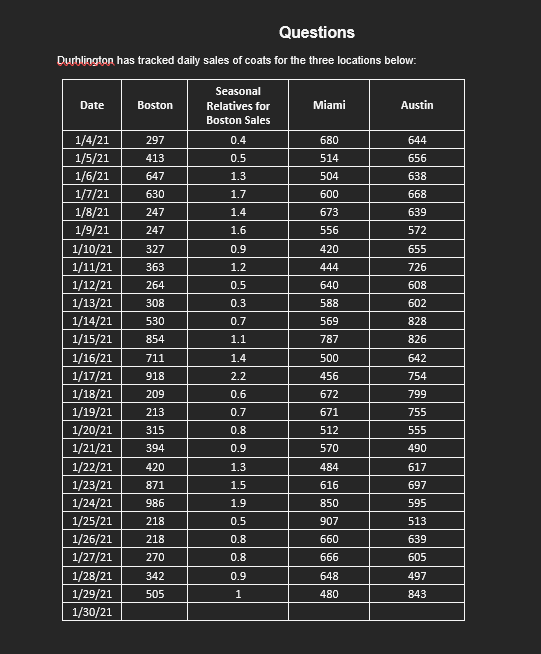
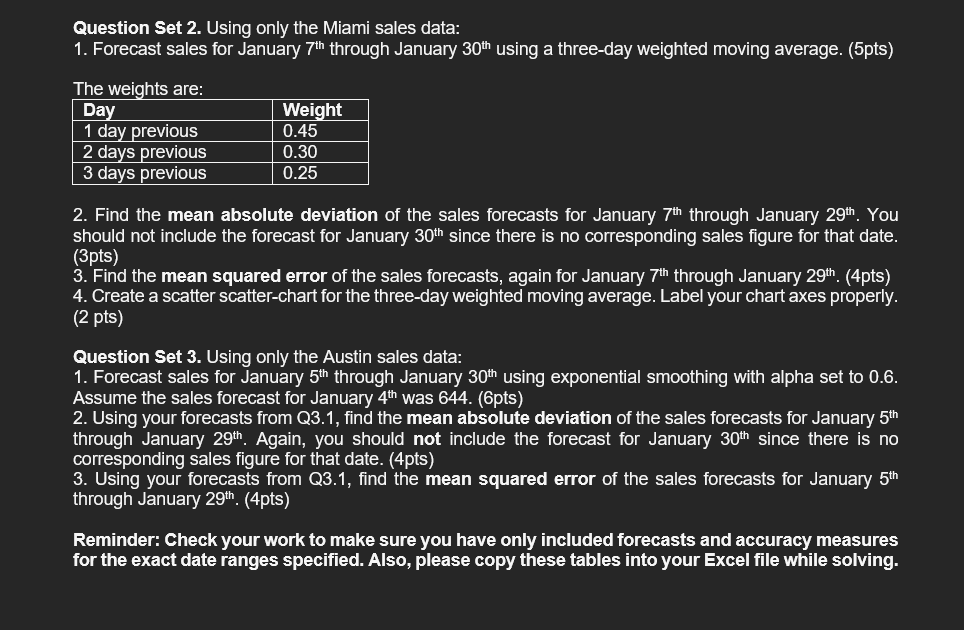
Durblington has tracked daily sales of coats for the three locations below: Question Set 2. Using only the Miami sales data: 1. Forecast sales for January 7th through January 30th using a three-day weighted moving average. (5pts) The weights are: 2. Find the mean absolute deviation of the sales forecasts for January 7th through January 29th. You should not include the forecast for January 30th since there is no corresponding sales figure for that date. (3pts) 3. Find the mean squared error of the sales forecasts, again for January 7th through January 29th. (4pts) 4. Create a scatter scatter-chart for the three-day weighted moving average. Label your chart axes properly. (2pts) Question Set 3. Using only the Austin sales data: 1. Forecast sales for January 5th through January 30th using exponential smoothing with alpha set to 0.6 . Assume the sales forecast for January 4th was 644 . (6pts) 2. Using your forecasts from Q3.1, find the mean absolute deviation of the sales forecasts for January 5th through January 29th. Again, you should not include the forecast for January 30th since there is no corresponding sales figure for that date. (4pts) 3. Using your forecasts from Q3.1, find the mean squared error of the sales forecasts for January 5th through January 29th. (4pts) Reminder: Check your work to make sure you have only included forecasts and accuracy measures for the exact date ranges specified. Also, please copy these tables into your Excel file while solving. Durblington has tracked daily sales of coats for the three locations below: Question Set 2. Using only the Miami sales data: 1. Forecast sales for January 7th through January 30th using a three-day weighted moving average. (5pts) The weights are: 2. Find the mean absolute deviation of the sales forecasts for January 7th through January 29th. You should not include the forecast for January 30th since there is no corresponding sales figure for that date. (3pts) 3. Find the mean squared error of the sales forecasts, again for January 7th through January 29th. (4pts) 4. Create a scatter scatter-chart for the three-day weighted moving average. Label your chart axes properly. (2pts) Question Set 3. Using only the Austin sales data: 1. Forecast sales for January 5th through January 30th using exponential smoothing with alpha set to 0.6 . Assume the sales forecast for January 4th was 644 . (6pts) 2. Using your forecasts from Q3.1, find the mean absolute deviation of the sales forecasts for January 5th through January 29th. Again, you should not include the forecast for January 30th since there is no corresponding sales figure for that date. (4pts) 3. Using your forecasts from Q3.1, find the mean squared error of the sales forecasts for January 5th through January 29th. (4pts) Reminder: Check your work to make sure you have only included forecasts and accuracy measures for the exact date ranges specified. Also, please copy these tables into your Excel file while solving


