please use EXCEL TO ANSWER THIS QUESTION
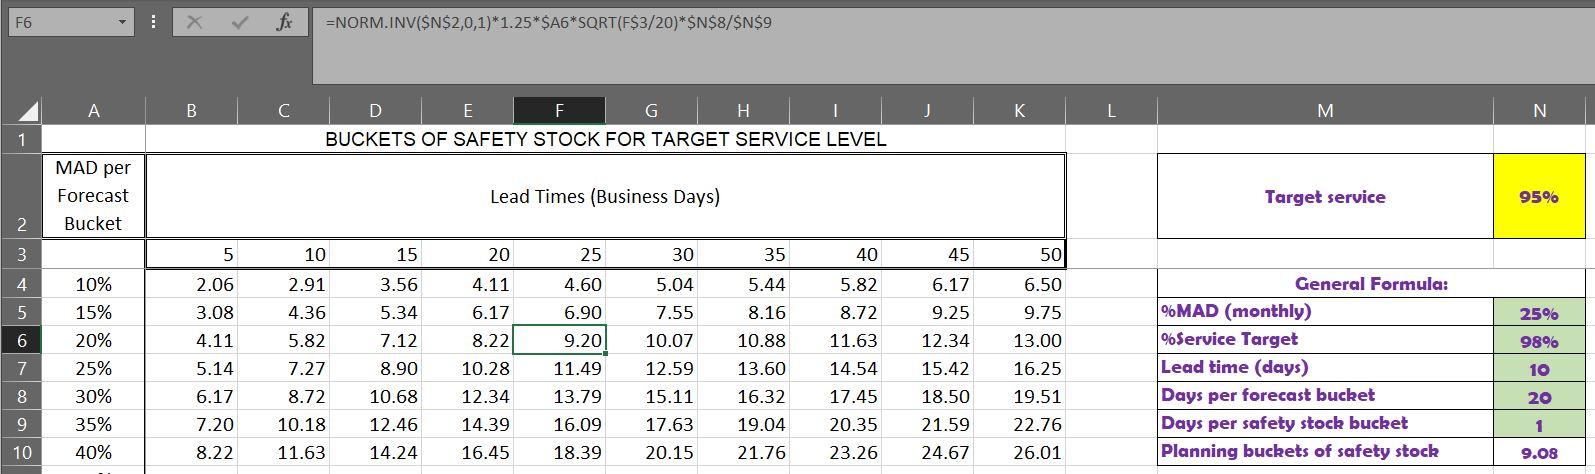
- A-items for the company are fairly predictable in sales volume, and have an MAD of 15%
- B-items for the company are less predictable in sales volumes, and have an MAD of 25%
- C-items for the company have very erratic demand, and have an MAD of 40%.
Assumptions:
- Lead time for the majority of products is 10 days.
- Target service level for B-items is 98%
QUESTION:
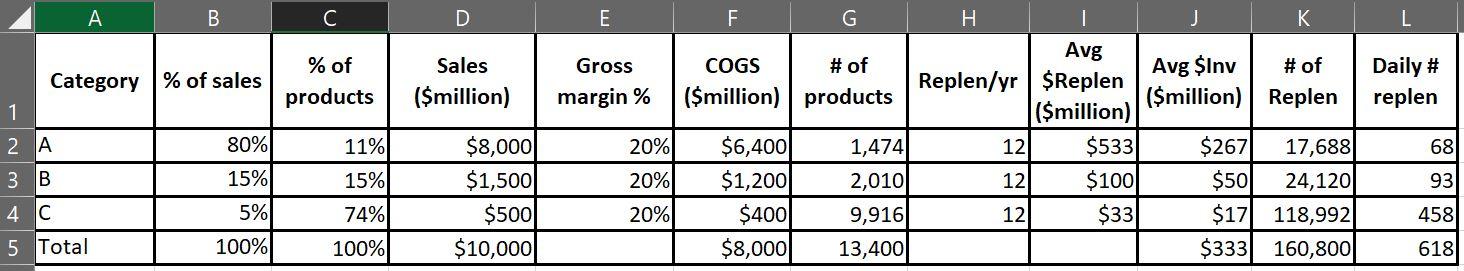
Given the info above... Create 5 alternative replenishment scenarios for the B-items on the PARETO EXCEL SHEET below --- and select which is best scenario.
You will need to consider safety stock and a change of service level to the spreadsheet below
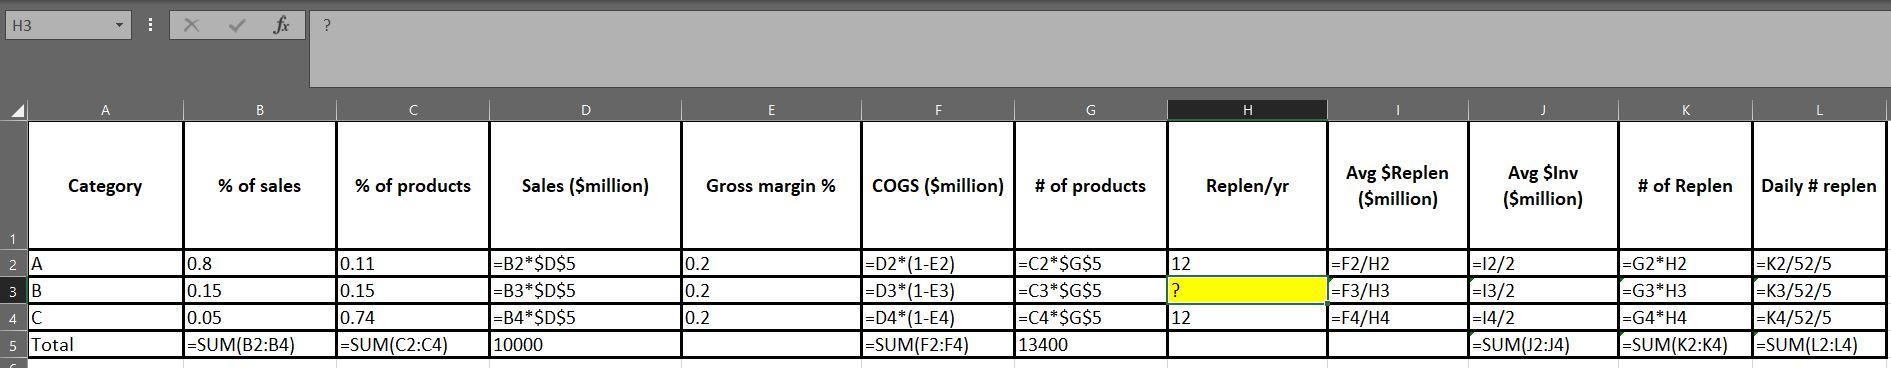
A B C E L Category % of sales % of products Sales ($million) Gross margin % Daily # replen 1 2 A 80% F G H . I J K Avg COGS # of Avg $Inv # of Replen/yr $Replen ($million) products ($million) Replen ($million) $6,400 1,474 12 $533 $2671 17,688 $1,200 2,010 12 $100 $50 24,120 $400 9,916 12 $331 $17 118,992 $8,000 13,4001 $333 160,800 11% 20% 68 3 B 15% 15% 93 $8,000 $1,500 $500 $10,000 20% 20% 4 C 5% 74% 458 5 Total 100% 100% 618 F6 fr =NORM.INV(SN$2,0,1)*1.25*$A6*SQRT(F$3/20)*$N$8/$N$9 A B C M N F G H BUCKETS OF SAFETY STOCK FOR TARGET SERVICE LEVEL 1 MAD per Lead Times (Business Days) Target service 95% Forecast Bucket 2 3 5 10 15 20 25 30 35 40 45 50 4 2.06 3.56 5.44 5 5.04 7.55 4.11 6.17 8.22 4.60 6.90 9.20 3.08 4.11 8.16 5.34 7.12 2596 6.17 9.25 12.34 6 10.07 98% 10% 15% 20% 25% 30% 35% 40% 7 2.91 4.36 5.82 7.27 8.72 10.18 11.63 6.50 9.75 13.00 16.25 19.51 22.76 8.90 15.42 5.14 6.17 7.20 8.22 10 5.82 8.72 11.63 14.54 17.45 20.35 23.26 8 10.28 12.34 14.39 16.45 20 General Formula: %MAD (monthly) %Service Target Lead time (days) Days per forecast bucket Days per safety stock bucket Planning buckets of safety stock 10.88 13.60 16.32 19.04 21.76 11.49 13.79 16.09 18.39 12.59 15.11 17.63 20.15 10.68 12.46 14.24 9 18.50 21.59 24.67 1 10 26.01 9.08 H3 fx ? B D H Category % of sales % of products Sales ($million) Gross margin % COGS ($million) # of products Replen/yr Avg $Replen ($million) Avg Siny (Smillion) # of Replen Daily #replen 1 2 A 0.8 12 3 B ? 0.11 0.15 0.74 =SUM(C2:04) 0.15 0.05 =SUM(B2:34) =B2*$D$5 =B3*$D$5 =B4*$D$5 10000 0.2 0.2 10.2 =D2*(1-E2) =D3*(1-E3) =D4*(1-E4) =SUM(F2:F4) =C2*$G$5 =C3*$G$5 =C4*$G$5 13400 =F2/H2 |=F3/H3 =F4/H4 =12/2 =13/2 =14/2 =SUM(12:34) =G2*H2 =G3*H3 I=G4*H4 =SUM(K2:64) =K2/52/5 =K3/52/5 =K4/52/5 =SUM(L2:L4) 12 4 TC 5 Total A B C E L Category % of sales % of products Sales ($million) Gross margin % Daily # replen 1 2 A 80% F G H . I J K Avg COGS # of Avg $Inv # of Replen/yr $Replen ($million) products ($million) Replen ($million) $6,400 1,474 12 $533 $2671 17,688 $1,200 2,010 12 $100 $50 24,120 $400 9,916 12 $331 $17 118,992 $8,000 13,4001 $333 160,800 11% 20% 68 3 B 15% 15% 93 $8,000 $1,500 $500 $10,000 20% 20% 4 C 5% 74% 458 5 Total 100% 100% 618 F6 fr =NORM.INV(SN$2,0,1)*1.25*$A6*SQRT(F$3/20)*$N$8/$N$9 A B C M N F G H BUCKETS OF SAFETY STOCK FOR TARGET SERVICE LEVEL 1 MAD per Lead Times (Business Days) Target service 95% Forecast Bucket 2 3 5 10 15 20 25 30 35 40 45 50 4 2.06 3.56 5.44 5 5.04 7.55 4.11 6.17 8.22 4.60 6.90 9.20 3.08 4.11 8.16 5.34 7.12 2596 6.17 9.25 12.34 6 10.07 98% 10% 15% 20% 25% 30% 35% 40% 7 2.91 4.36 5.82 7.27 8.72 10.18 11.63 6.50 9.75 13.00 16.25 19.51 22.76 8.90 15.42 5.14 6.17 7.20 8.22 10 5.82 8.72 11.63 14.54 17.45 20.35 23.26 8 10.28 12.34 14.39 16.45 20 General Formula: %MAD (monthly) %Service Target Lead time (days) Days per forecast bucket Days per safety stock bucket Planning buckets of safety stock 10.88 13.60 16.32 19.04 21.76 11.49 13.79 16.09 18.39 12.59 15.11 17.63 20.15 10.68 12.46 14.24 9 18.50 21.59 24.67 1 10 26.01 9.08 H3 fx ? B D H Category % of sales % of products Sales ($million) Gross margin % COGS ($million) # of products Replen/yr Avg $Replen ($million) Avg Siny (Smillion) # of Replen Daily #replen 1 2 A 0.8 12 3 B ? 0.11 0.15 0.74 =SUM(C2:04) 0.15 0.05 =SUM(B2:34) =B2*$D$5 =B3*$D$5 =B4*$D$5 10000 0.2 0.2 10.2 =D2*(1-E2) =D3*(1-E3) =D4*(1-E4) =SUM(F2:F4) =C2*$G$5 =C3*$G$5 =C4*$G$5 13400 =F2/H2 |=F3/H3 =F4/H4 =12/2 =13/2 =14/2 =SUM(12:34) =G2*H2 =G3*H3 I=G4*H4 =SUM(K2:64) =K2/52/5 =K3/52/5 =K4/52/5 =SUM(L2:L4) 12 4 TC 5 Total