PLEASE USE EXCEL TO SHOW WORK AND PROVIDE FORMULAS ON EXCEL. DO NOT WRITE OUT ANSWERS INSTEAD PLEASE PROVIDE ANSWERS AND FORMULAS ON EXCEL. THANK YOU

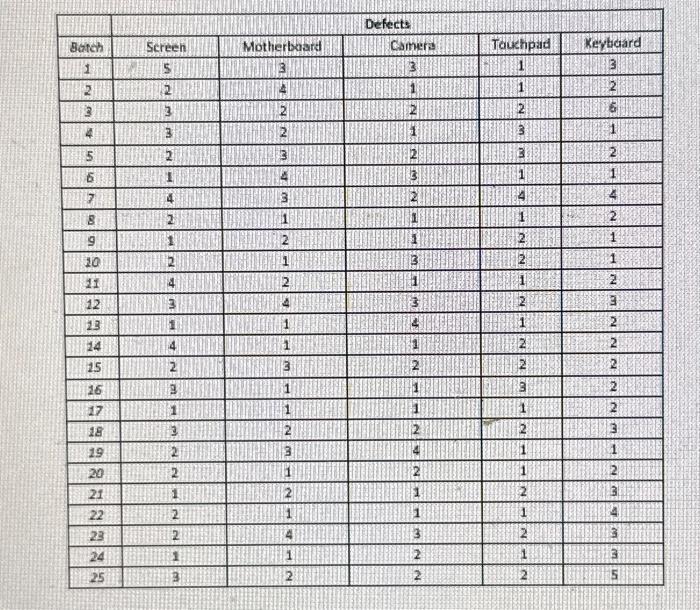
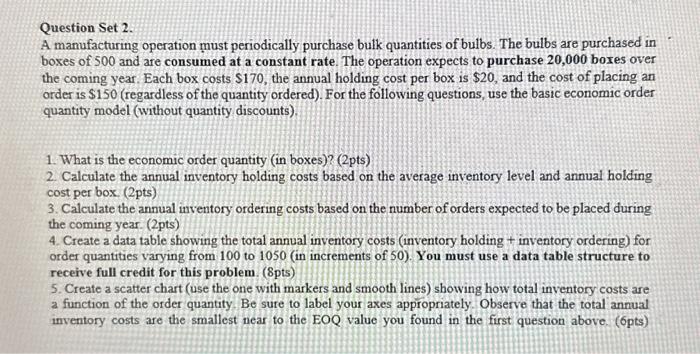
\begin{tabular}{|c|c|c|c|c|c|} \hline & & in & Defects & & y \\ \hline Batch & Screen & Motherboard & Camera & Touchpad & Keybicard \\ \hline 1 & & 1 & 3 & Ei & 3 \\ \hline 2 & 2 & min & 1 & 1 & 2 \\ \hline 3 & 3 & 37 & 2 & 2 & 6 \\ \hline 4 & 3 & 2 & 1. & 3 & 1 \\ \hline 5 & 2 & 3 & 2. & 3 & 2 \\ \hline 6 & 4 & 4 & 31 & 1 & 1. \\ \hline 7 & 4 & 4 & 2 & 4 & 4 \\ \hline 8 & 2 & 3 & 3 & 1 & x \\ \hline 9 & 1 & & {[} & 2 & 1 \\ \hline 20 & 2 & & 3 & 2 & 1 \\ \hline 11 & 4 & 5 & 1 & 1 & 2 \\ \hline 12 & 3 & & & 2 & 3 \\ \hline 23 & 1 & m & 4 & 1 & 2 \\ \hline 14 & 4 & & 1 & 2 & 2 \\ \hline 25 & 2 & & 2 & 2 & 2 \\ \hline 16 & 3 & m & 1 & 3 & 2 \\ \hline 17 & +2 & & 1 & 1 & 2 \\ \hline 18 & 3 & 2 & 2 & 2 & 3 \\ \hline 19 & 2 & 4 & 4 & 1 & 1 \\ \hline 20 & 2 & & 2 & 1 & 2 \\ \hline 21 & 1 & & 1 & 2 & 3 \\ \hline 22 & 2 & 5 & 1 & 1 & 4 \\ \hline 23 & 2 & 4 & 3 & 2 & 3 \\ \hline 24 & 1 & & 2 & 1 & 3 \\ \hline 25 & 3 & 37 & 2 & 2 & 5 \\ \hline \end{tabular} Question Set 2. A manufacturing operation must periodically purchase bulk quantities of bulbs. The bulbs are purchased in boxes of 500 and are consumed at a constant rate. The operation expects to purchase 20,000 boxes over the coming year. Each box costs $170, the annual holding cost per box is $20, and the cost of placing an order is $150 (regardless of the quantity ordered). For the following questions, use the basic economic order quantity model (without quantity discounts). 1. What is the economic order quantity (in boxes)? (2pts) 2. Calculate the annual inventory holding costs based on the average inventory level and annual holding cost per box. (2pts) 3. Calculate the annual inventory ordering costs based on the number of orders expected to be placed during the coming year. (2pts) 4. Create a data table showing the total annual inventory costs (inventory holding + inventory ordering) for order quantities varying from 100 to 1050 (in increments of 50). You must use a data table structure to receive full credit for this problem. (8pts) 5. Create a scatter chart (use the one with markers and smooth lines) showing how total inventory costs are a function of the order quantity. Be sure to label your axes appropriately. Observe that the total annual inventory costs are the smallest near to the EOQ value you found in the first question above. (6pts)


